So that venerable cycling magazine – FORBES – comes out with an article written by “Data Journalist” Niall McCarthy… about “the Most Dangerous Cities” in the US for bicycling.
McCarthy concludes that little old Columbus, Ohio was NUMBER SIX – the 6th most dangerous city in the entire country for riding a bike… I was… surprised…
Ok… Well… that sounds interesting… I wonder what data he used. What other cities were in the Top 10? Since Florida is the league leader in cycling fatalities I’ll bet several Florida cities were in there too, right?
Being a math guy who studies bicycle crashes and researches EVERY fatal bicycle crash in Ohio I was very curious about the data and methodology he developed to reach this somewhat shocking conclusion.
My conclusion? The article is STOOOOOPID… the list is STOOOOPID… why? It’s based on data for cities with populations in excess of 500,000 when some of THE MOST DANGEROUS CITIES have populations less than 500,000.
Here’s the list that McCarthy came up with:
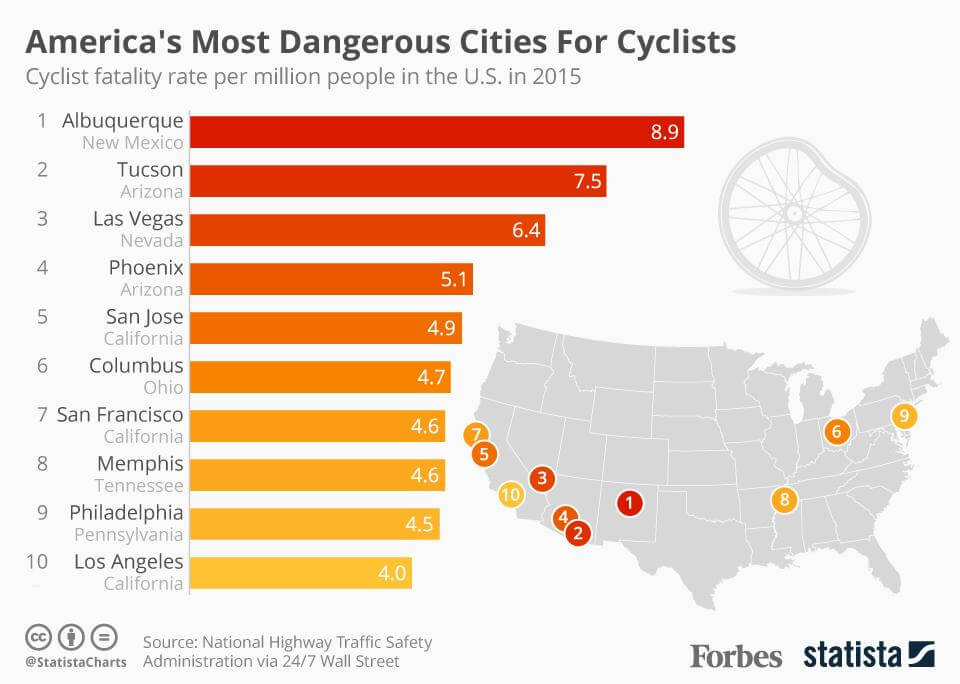
As soon as I saw this list I thought, “Hmmmm… where are all the Florida cities?” Florida is renowned for having, by FAR, the highest number of cycling fatalities and the worst “fatality rate” in the country…year after year after year… The fact that there were no Florida cities on McCarthy’s Top 10 list immediately made my very suspicious of McCarthy’s conclusion and the “data” he “relied upon.”
So what “Data” did McCarthy use to reach the conclusion that Columbus, Ohio is the 6th Most Dangerous city in which to ride a bicycle?
Here’s the biggest Ohio cities:
| Ohio | 11,536,504 |
| Columbus city | 787,033 |
| Cleveland city | 396,815 |
| Cincinnati city | 296,943 |
| Toledo city | 287,208 |
| Akron city | 199,110 |
| Dayton city | 141,527 |
Surprising to me that Cleveland and Cincinnati are so small, but that is, I suspect, more a factor of how Columbus grew in the past 50 years – by eating up outlying areas – compared to the other large Ohio cities. For example, there are something like 80 different municipalities [all of which with their own “bike laws”] in Cuyahoga County and 50 or so in Hamilton [Cincinnati]. Look at population by county and its a LOT closer.
| Rank | County | Population |
|---|---|---|
| 1 | Franklin County | 1,264,518 |
| 2 | Cuyahoga County | 1,249,352 |
| 3 | Hamilton County | 809,099 |
| 4 | Summit County | 540,300 |
| 5 | Montgomery County | 531,239 |
| 6 | Lucas County | 432,488 |
It would have made more sense to look at data by county, instead of by city, but that’s not what happened here. It would have made sense to look at data for more than one year – look at historical data. This is especially true when the year McCarthy looked at, 2015, was the worst year in recent history. But, again, that’s not what happened here.
McCarthy “concludes” that by looking at ONE STAT for ONE YEAR’s worth of data for SOME BUT NOT ALL CITIES he can, as a “data journalist,” leap to the extraordinary [I was say “IMAGINARY”] conclusion about how”DANGEROUS” a city is for cyclists. This is, to me, laughable – simplistic – ludicrous – stoooooopid!!
The ONE STAT McCarthy used, or rather plunked from another article, was the “Fatality Rate” – a number representing a ratio of how many cyclists died per 100,000 people that live in the city. So if 2 cyclists are killed and the city population is 200,000 then the “rate” is 1.0 [1 person killed per 100,000 people].
This stat ONLY tells you what it tells you – a ratio of deaths to population. It does NOT tell you ANYTHING about “risk” or “how dangerous” it is to ride a bicycle. Why? Because we know NOTHING about exposure – use – what I call “the denominator.” If you live in a city where there is a LOT of cycling going on [like…say… Columbus, Ohio…] how can say it’s “more dangerous” to ride there… with a lot of exposure, a lot of use, there are more opportunities for things to happen. There are also far more “rides” and far more “safe” rides than in other cities. To calculate “risk” and “danger” you need to know usage – and we just do not have good numbers for that.
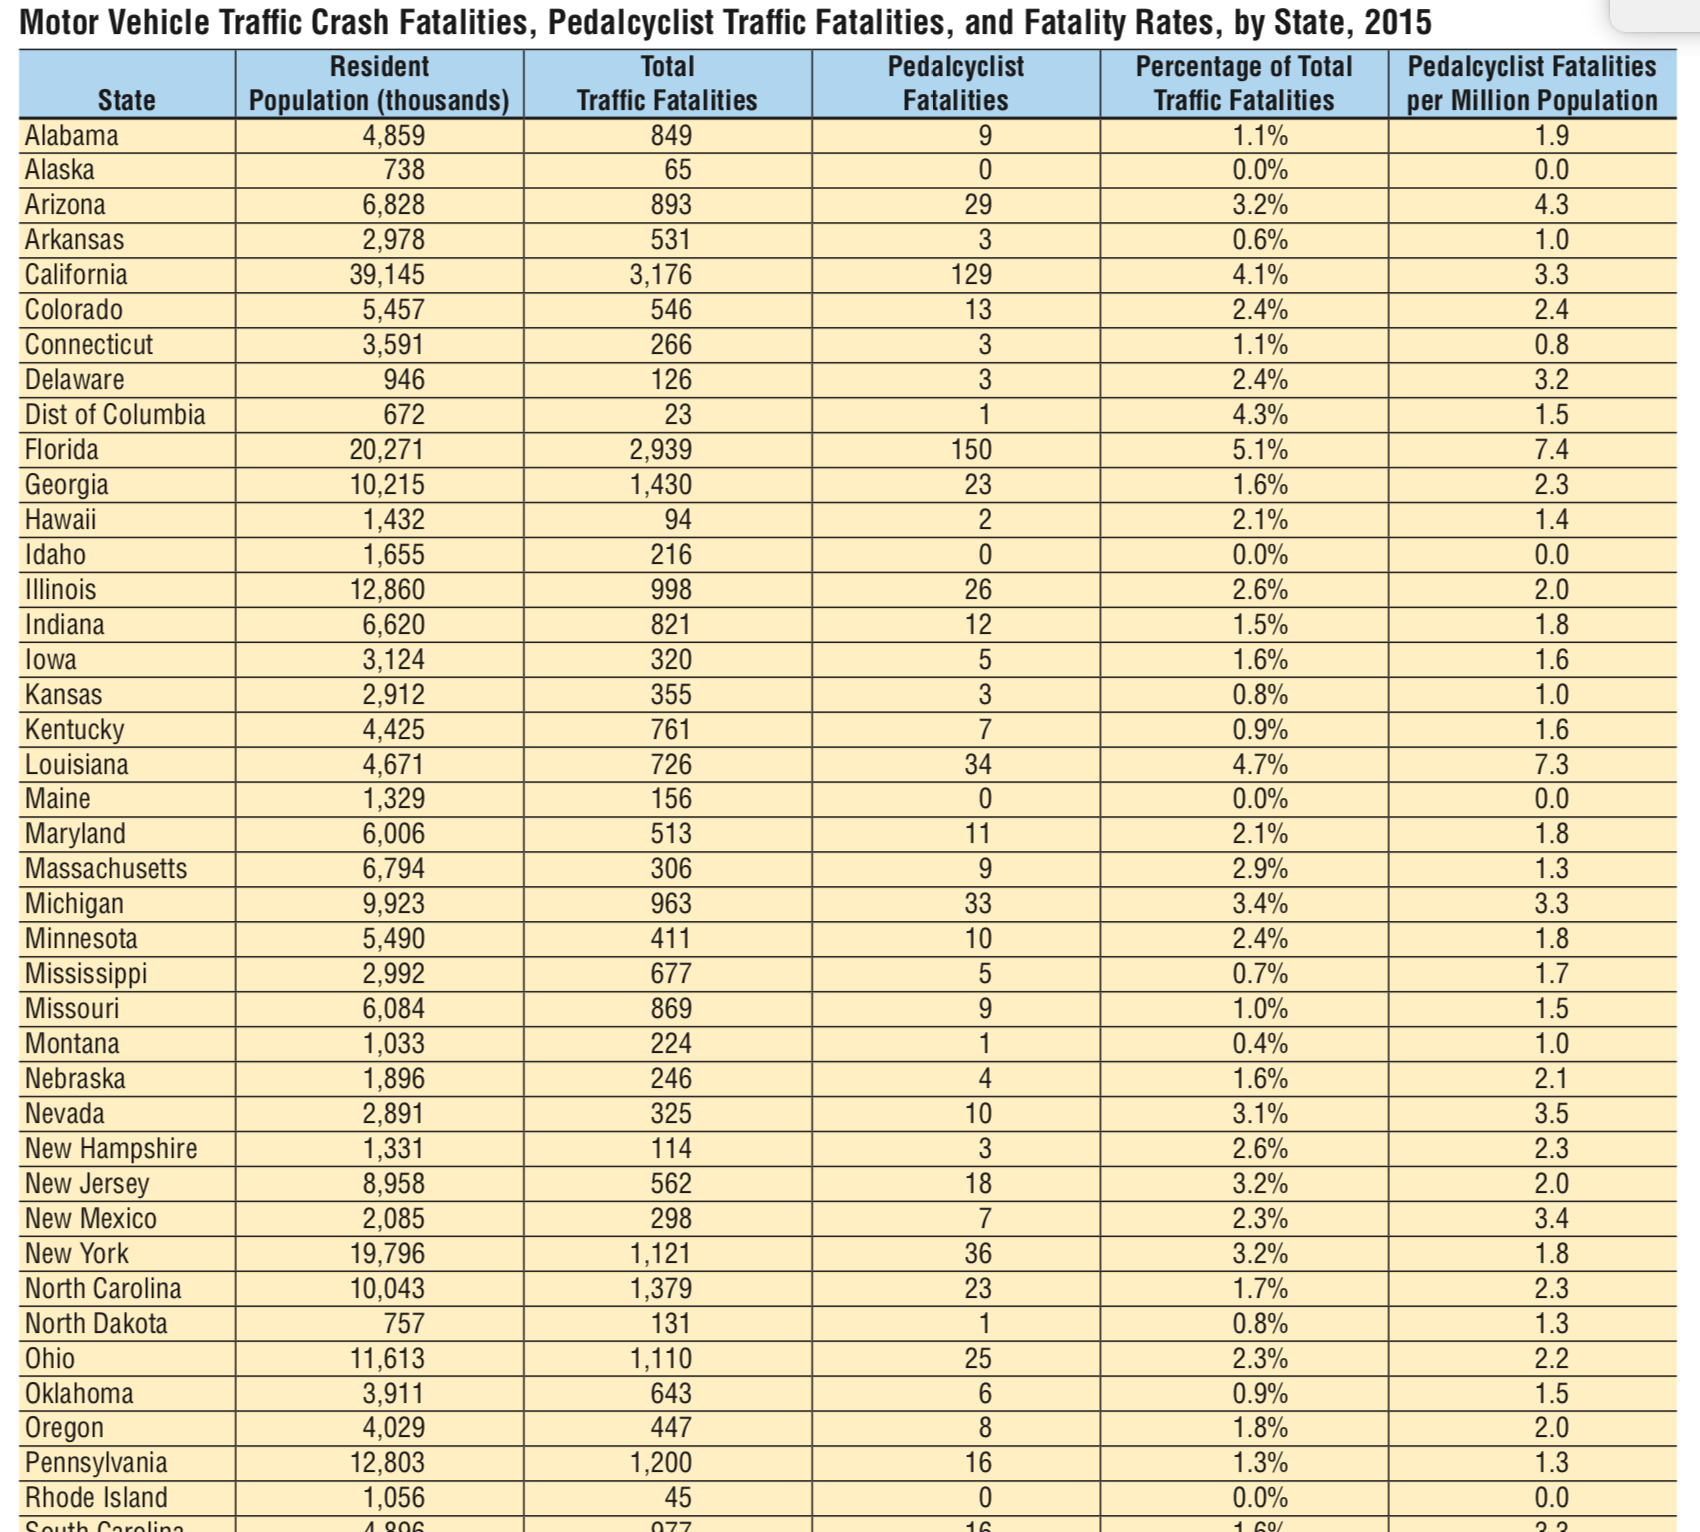
Let’s look at the Fatality Rate, though. From a statewide perspective, for example, Florida has… by FAR… the worst fatality rate in the country. In 2015 there were 150 cyclists killed in Florida, which has a population of 20.2 millions it’s fatality rate is 7.4. Indeed, cycling fatalities make up a whopping 5+% of all Florida traffic deaths – again the worst in the country.
At least one article in an insurance publication confirmed my view that Florida is, by far, the most dangerous state for cyclists.
In contrast, Ohio is always one of the safest states, with a fatality typically below the “average” fo rate 50 states. In 2015, a very bad year for Ohio, we had 25 cycling fatalities. Despite that, our “fatality rate” was 2.2 – still below the average of 2.5! So how could a state like Florida, with the worst fatality rate, by far, have ZERO cities in the “Top 10 Most Dangerous” but Ohio, one of the safest states, has the Number 6 “Worst” city?
Doesn’t make sense, eh?
Let’s look at a couple other problems with McCarthy’s conclusion.
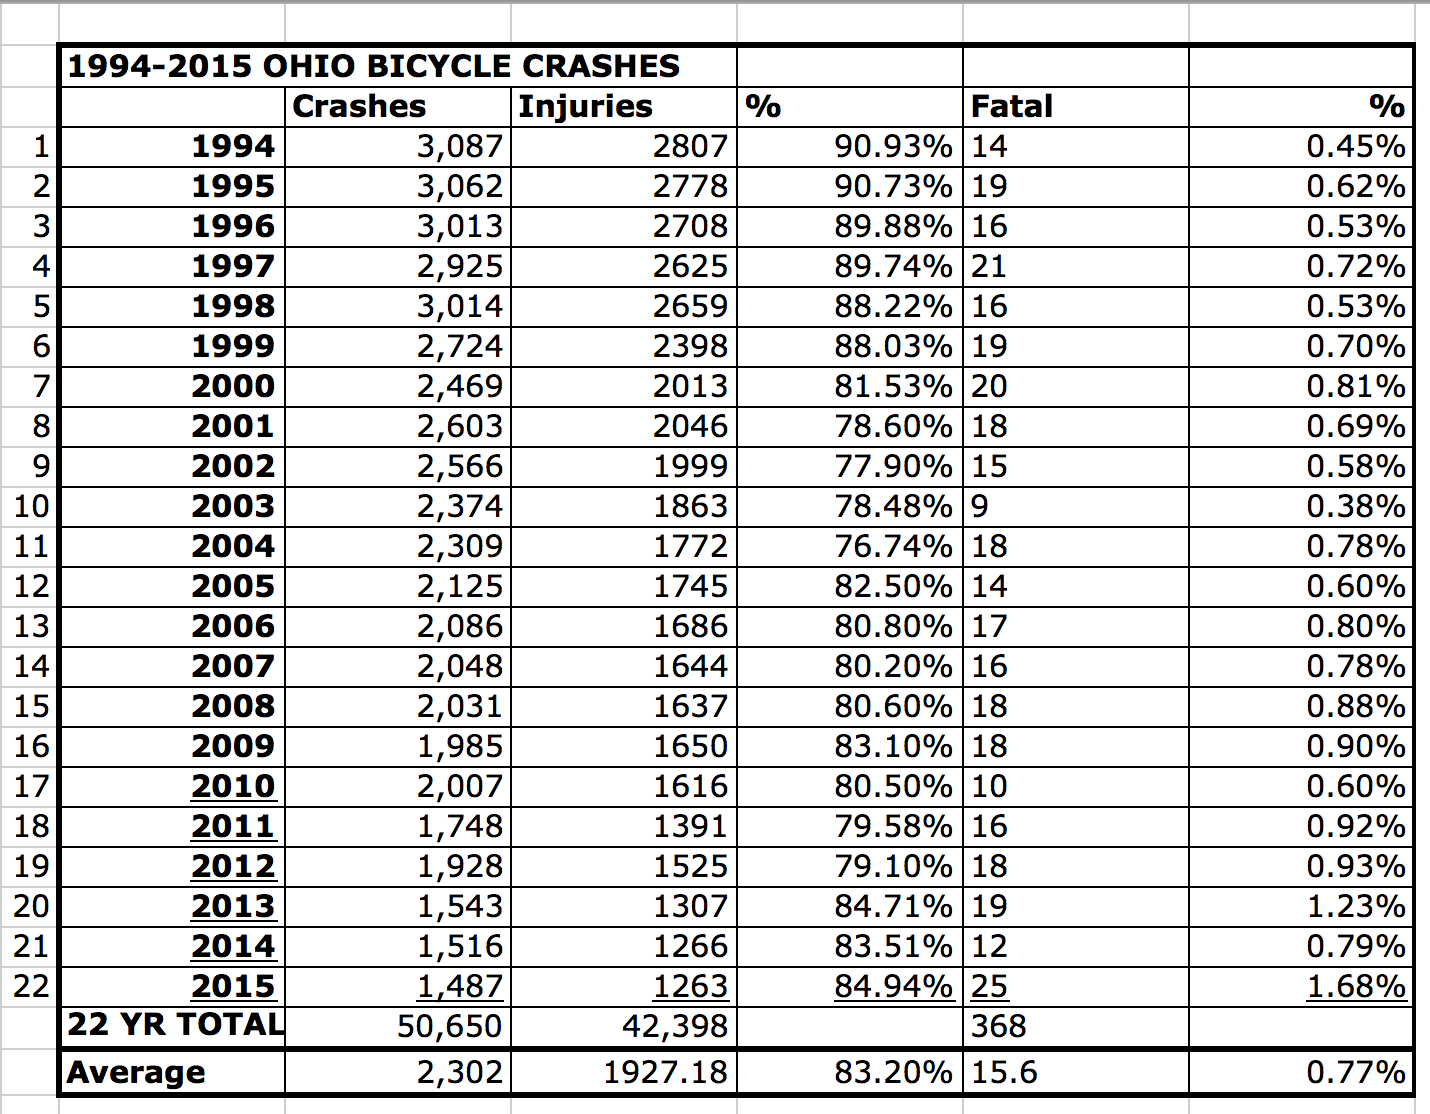
The ONE YEAR that McCarthy chose to use was 2015 – the WORST year in recent history for ALL traffic safety patterns. 2015 was the worst year in Ohio’s history for cycling fatalities. Ohio averages around 16 cycling deaths per year. The 25 we had in 2015 was a statistical aberration – an outlier. Columbus had 4 cycling deaths – again an outlier as that had not happened at any time in the recent past.
McCarthy completely fails to look at HISTORY – rather he looked at one stat for one bad year and decided “therefore” Columbus is more dangerous to cyclists than every city in Florida… This makes NO sense…
What were the “fatality rates” for Florida’s cities? Well… we don’t know.
First McCarthy didn’t tell us.
Second, the data McCarthy relied on only looked at cycling in “bigger” cities – cities with MORE THAN 500,000 people! McCarthy doesn’t tell us that unfortunately. I dug that out of the data from the article he sort of read a part of before condemning Columbus, Ohio to this “Worst” list. In fact, if he had actually READ that article he would have seen that it only looked at THIRTY-TWO of the largest cities… those over 500,000.
So why does that matter? Which cities are missing?
Well, here’s an article from 2014 listing the 10 Worst Cities for Cycling & Walking. This author cites to Transportation for America and concludes that the Top Ten Worst are:
1. Orlando/Kissimmee, Florida
2. Tampa/St. Petersburg/Clearwater, Florida
3. Jacksonville, Florida
4. Miami/Fort Lauderdale/Pompano, Florida
5. Riverside/San Bernardino/Ontario, California
6. Las Vegas/Paradise, Nevada
7. Memphis, Tennessee
8. Phoenix/Mesa/Scottsdale, Arizona
9. Houston/Sugar Land/Baytown, Texas
10. Dallas/Fort Worth/Arlington, Texas
This list makes much more sense to me. The state with the worst fatality rate, Florida, has the worst 4 cities for bicycling and walking. How could this list be so different from McCarthy’s?
Well by limiting his article …er … limiting his “data research” to reading part of one article that only looked at limited data from the Top 32 bigger cities for one year… McCarthy failed to dig up any data about Miami [#44 – 399K population] and Orlando [ #73 – 248K pop.] and Tampa [#53 – 347K pop]. Jacksonville comes in at number 12 with 821,000 people. So the data for the 3 of the 4 “Worst” cities for cycling in one recent article was apparently never even considered.
Now, I had to do some digging, but Florida publishes a nice big [huge] stat book on crashes. They do not break down the numbers here by city, but by county.
Broward County [1.8M people] 14 fatalities Fatality Rate 7.7
Miami/Dade [2.5M] 18 fatalities Fatality Rate 7.2
Palm Beach [1.3M] had 17 fatalities Fatality Rate 13.1
Orange [1.2M] 10 fatalities Fatality Rate 8.3
Total Population ~6.8M 59 fatalities Fatality Rate: 8.6
The key cities in these 4 counties are Fort Lauderdale [Broward], Miami, West Palm Beach and Orlando [Orange].
Had McCarthy done a little digging he would have seen that these four counties, which have a total of some 6.8 million people, had a combined 59 cycling fatalities – 59! More cyclists died in those 4 Florida counties than died in ANY OTHER STATE in the country except California! Given that Florida had 154 cyclists killed that means 95 cyclists were killed the other Florida counties!
Had McCarthy done a little math, as I did above, he would see that the counties with those “big” cities in Florida, which he failed to count, had a average fatality rate of 8.6 deaths per 100,000 people – a rate that would have put them in the top 5! Palm Beach County and a rate of 13.1 cyclists killed per 100,000 people, almost DOUBLE McCarthy’s “worst” city!
What about “small” numbers generally? Columbus had 4 deaths in 2016. If they had, say 2, instead of 4 then the “fate” is cut in half and they are nowhere near the “Top 10 Most Dangerous” cities. 2.. .that’s a very small number… we’re not counting dozens or hundreds or thousands… these are single digit numbers that change every year, and a very small change is a very large PERCENTAGE change.
What about the history of crashes? In my review of fatal crash data Columbus [Franklin County] is certainly the one city in the state which consistently at least 1 fatal crash. However, they’ve not had 4 in one year… other than 2015. Here’s what the state numbers, and the county numbers for Ohio’s three biggest counties, looked like from 2013-2016:
Sorry – not buying it -that’s a STOOOPID conclusion in my opinion. It’s a shame to see a publication like Forbes label Columbus as a bad, dangerous cycling city with such flimsy, weak data…I’d say McCarthy owes a refund to the school that provided him with a degree in “data journalism.” He read a little bit of one article and unfairly published a “conclusion” that makes no sense…
© 2024.


Very nice analysis!
“To calculate ‘risk’ and ‘danger’ you need to know usage – and we just do not have good numbers for that.” I would want to know fatalities (or crashes) per mile cycled, and it is disappointed to know we don’t have that data. If we don’t, the no one can credibly claim to know which cites (or counties) are quantitatively the most dangerous.
Risk can be looked at through a per capita approach, but the better approach would be to know actual exposure…either miles ridden or hours of exposure. There have been some attempts by a few folks to try to quantify this but extrapolating data about bicycle use is a far cry from using car data.