Pedestrian crashes SEEM to be in the news a lot… it SEEMS like there’s a bunch of them, right?
Well… the data confirms that.
The GHSA looked at the data. First they compared 2008 to 2017. They found that overall traffic deaths were 6% LOWER in 2017…but… pedestrian fatalities were up a whopping 35%! So while all the Car Safety Experts are walking around patting themselves on the back on their success in reducing fatalities, the MOST VULNERABLE users of the road are experiencing more terror and mayhem now than they did 20 years ago…
What’s going on?
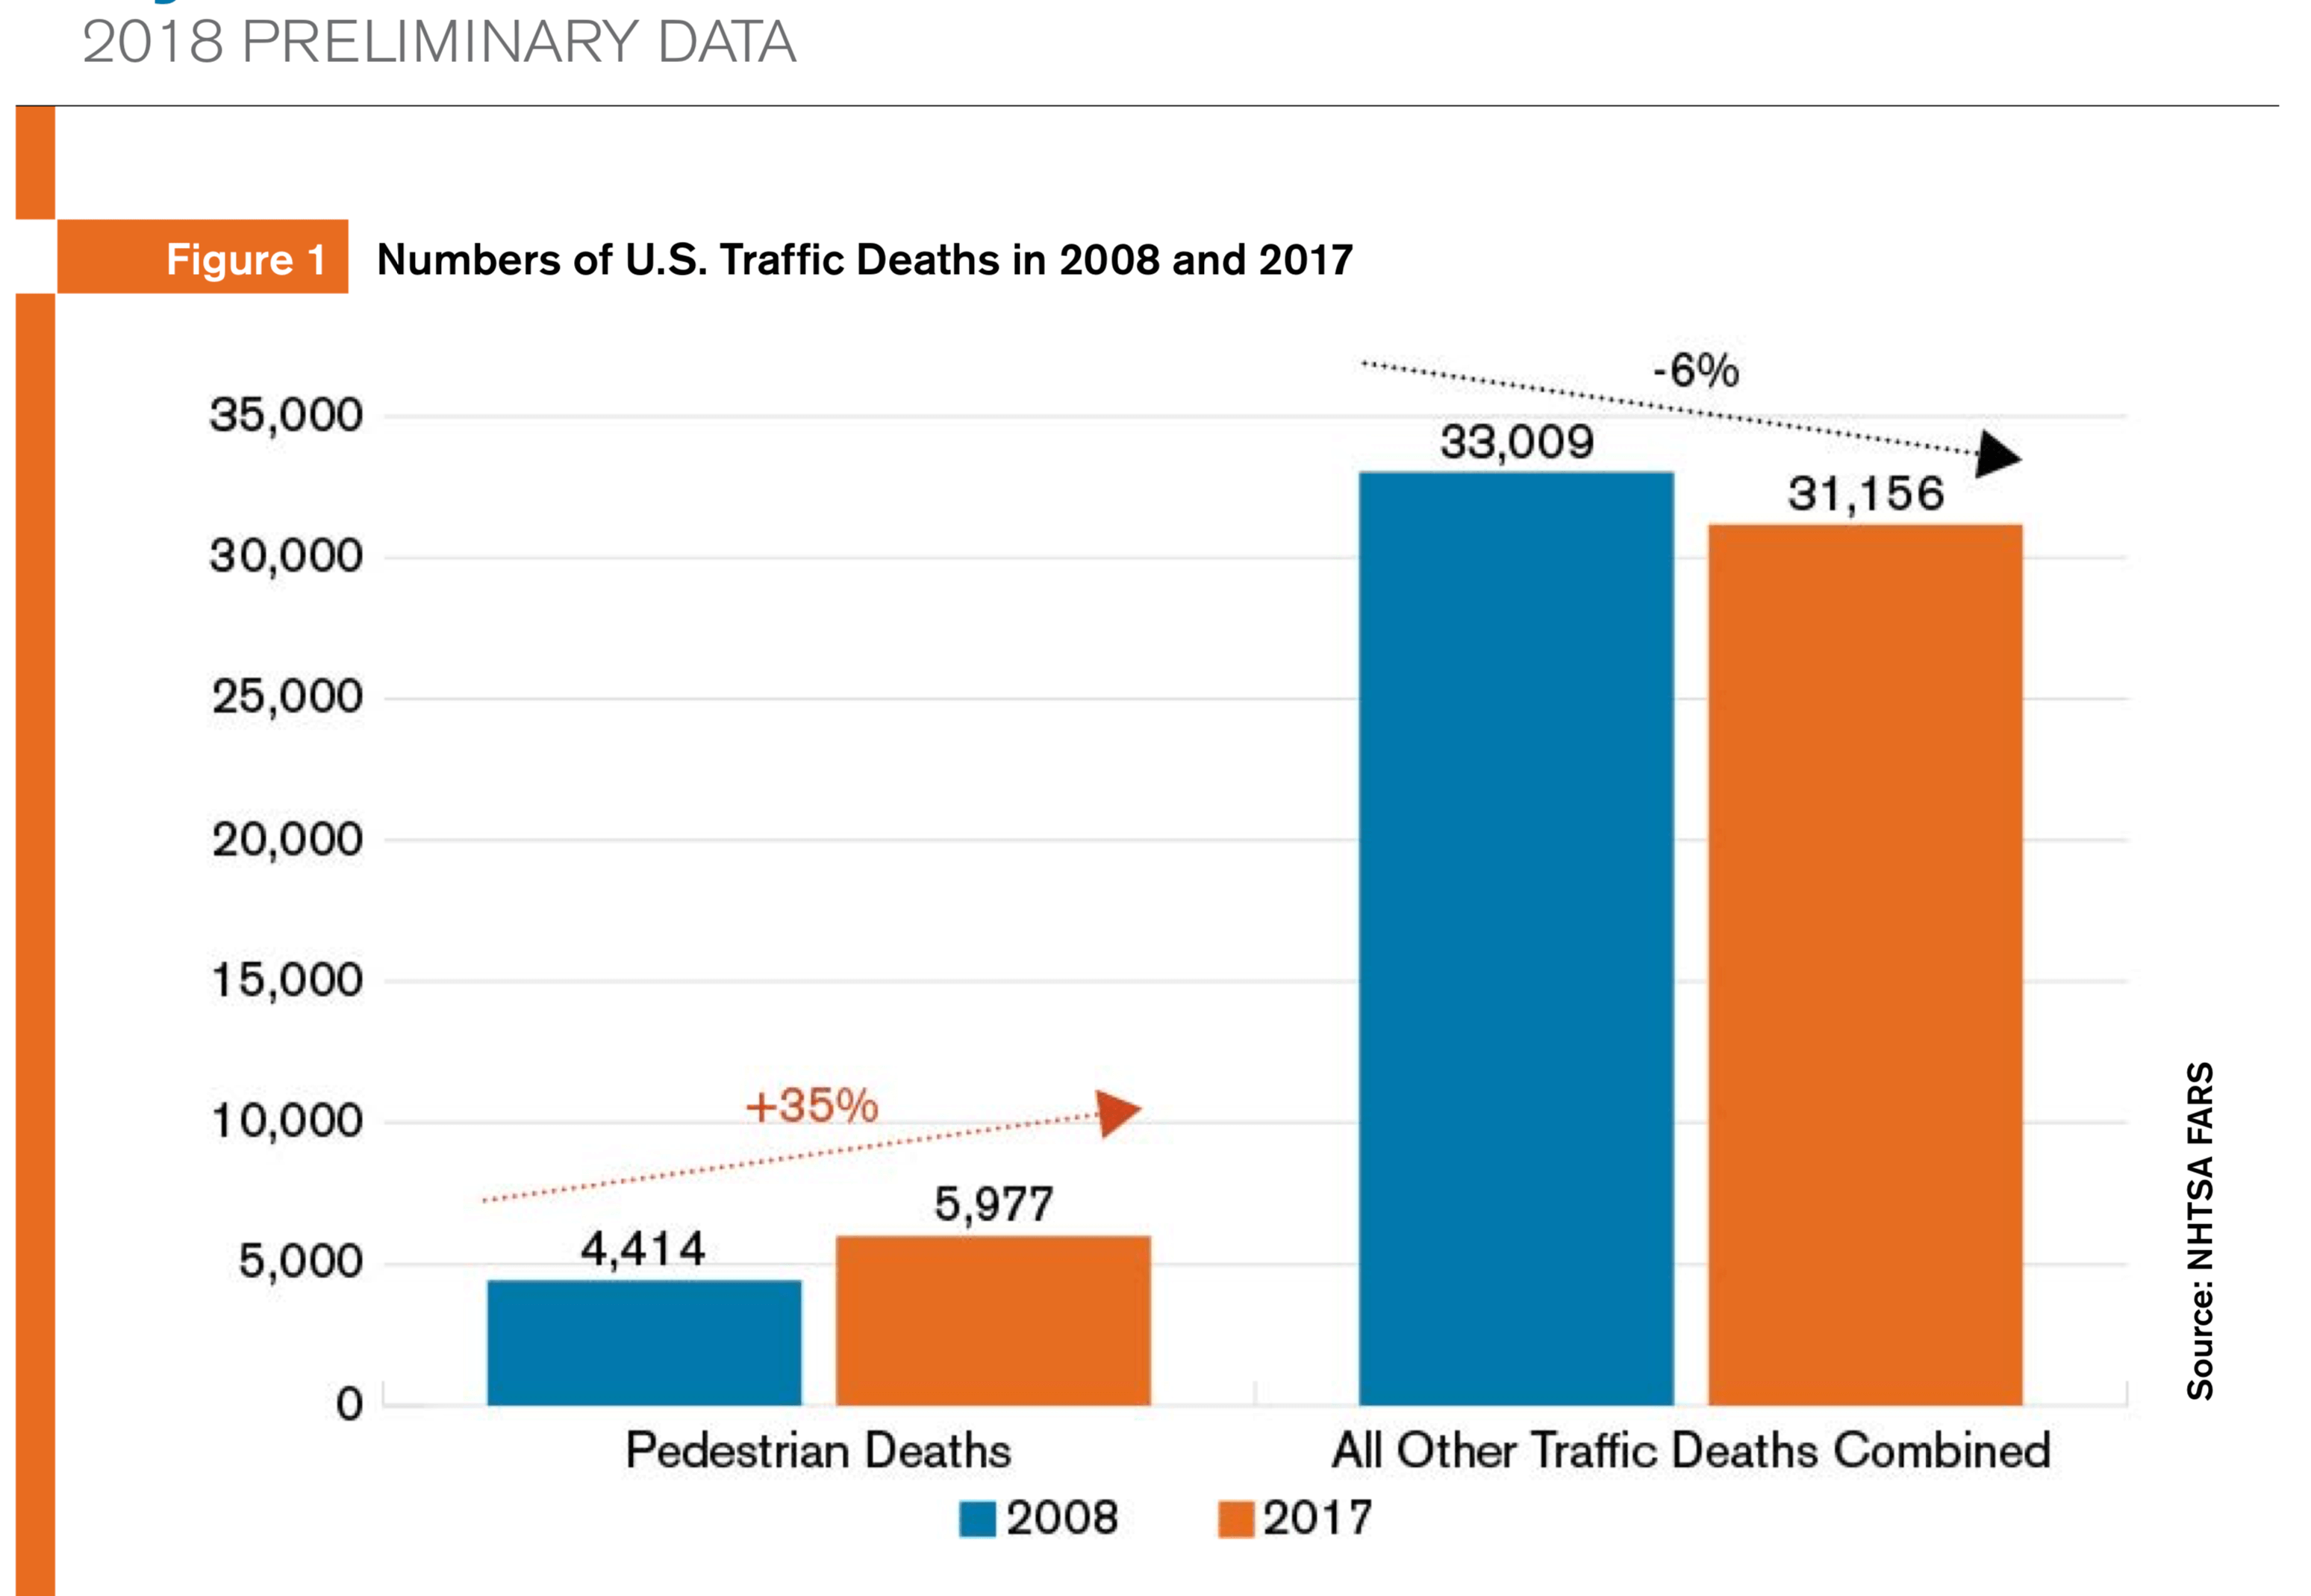
Comparing 2017 & 2018 data confirms what we’re all seeing and feeling… that pedestrian crashes and deaths are going up, even while overall traffic deaths dropped a bit…
WHERE ARE DEADLY CRASHES OCCURRING?
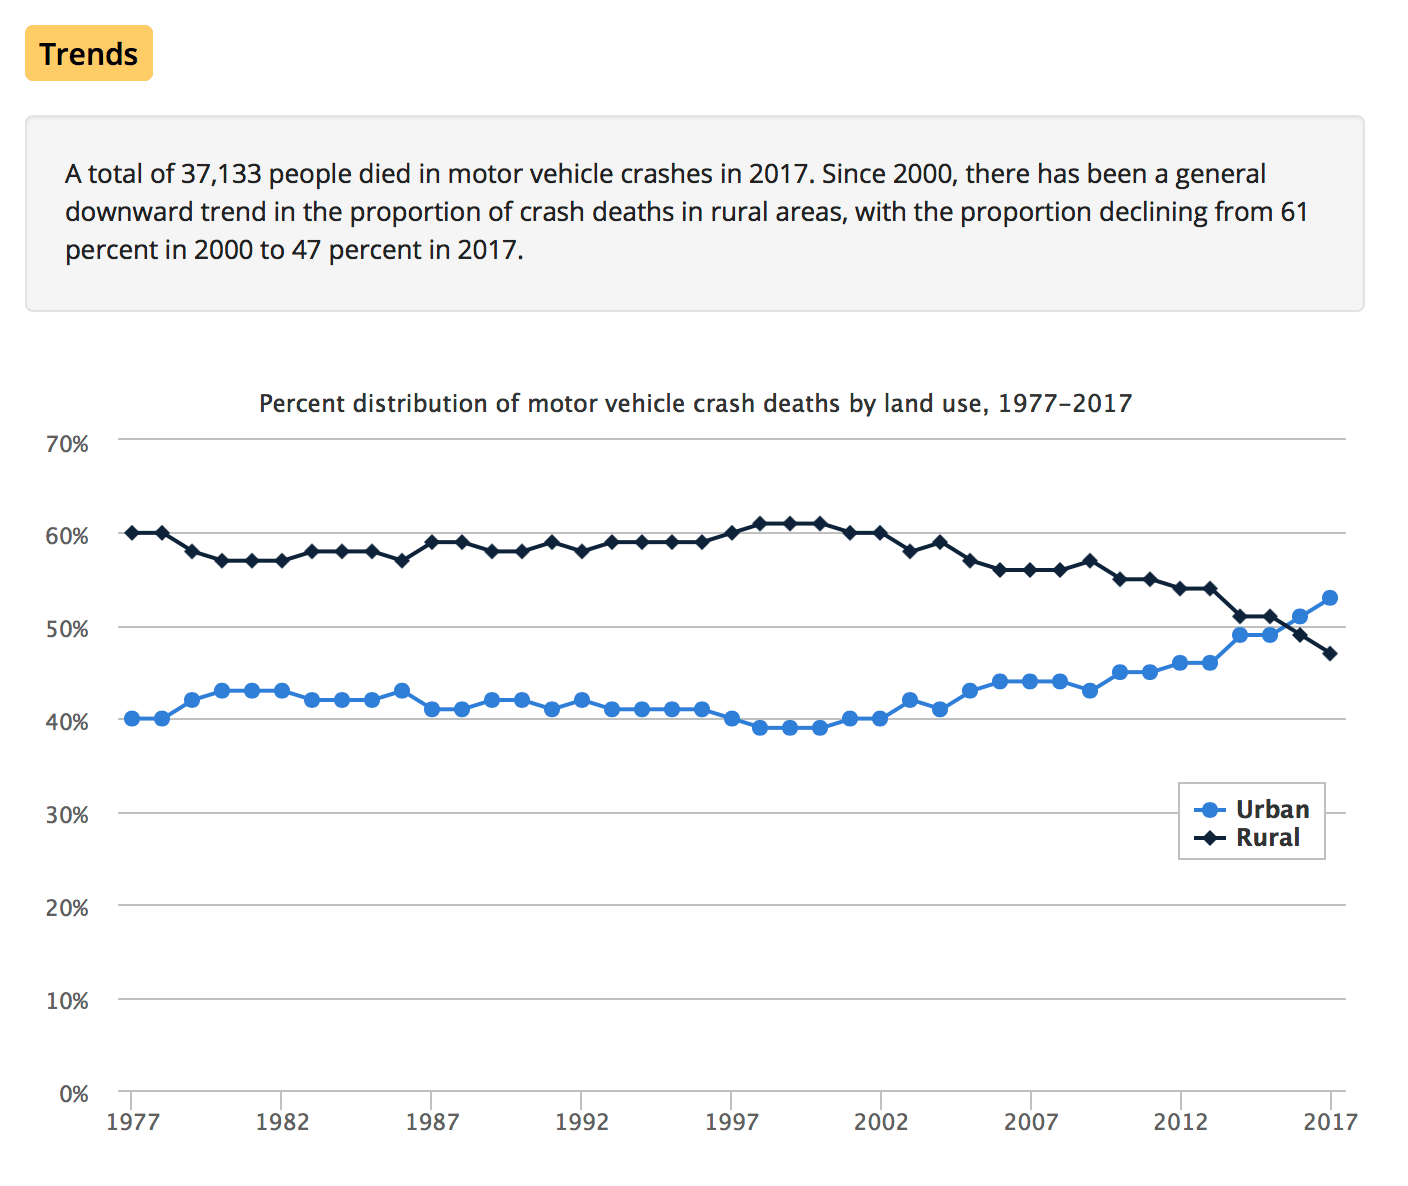
One interesting stat though is WHERE fatalities are occurring… this may help us understand more about cycling & pedestrian fatalities… For many years RURAL crashes led to more fatalities than Urban crashes… but… in the last decade rural crashes leading to death have declined while urban crashes leading to death have increased…
CYCLING FATALITIES TRENDING UP IN THE LAST DECADE
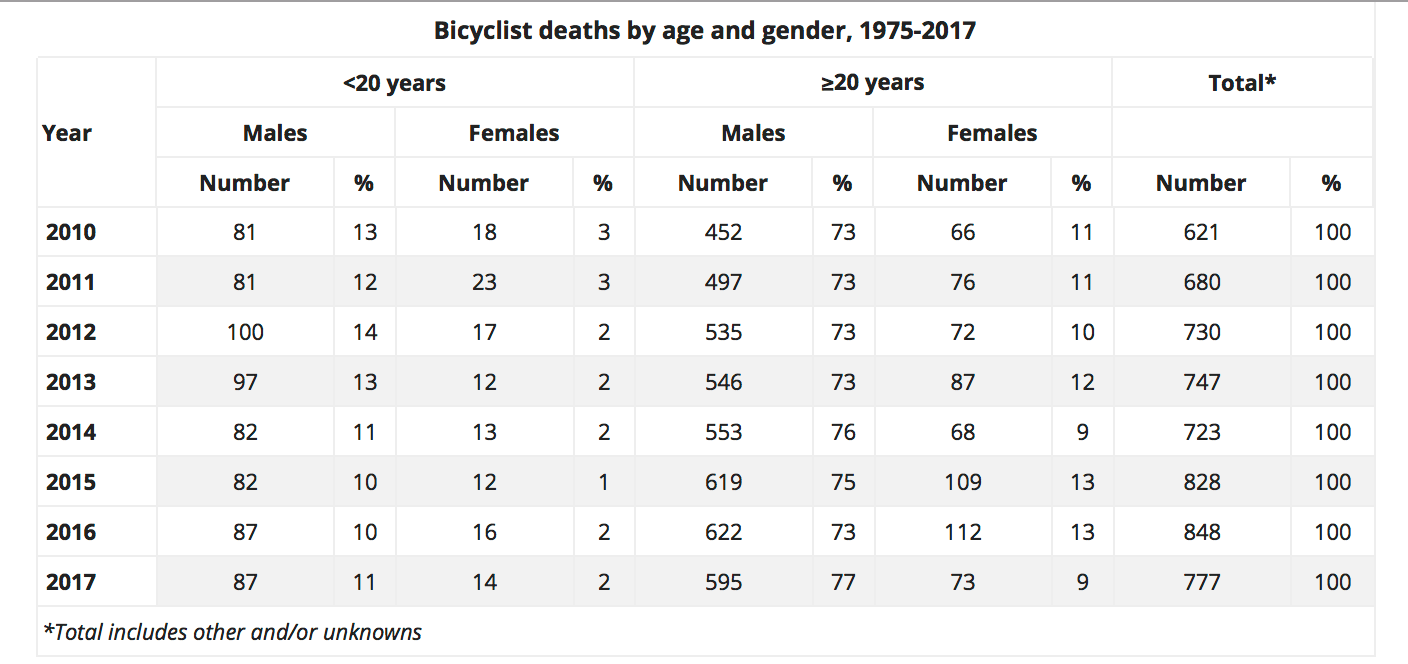
Cyclist fatalities are trending the same way unfortunately. The decade of the 1970s was the worst decade for cycling deaths, but the number of cycling fatalities in the U.S. dropped significantly each decade… until 2008 or 2009… 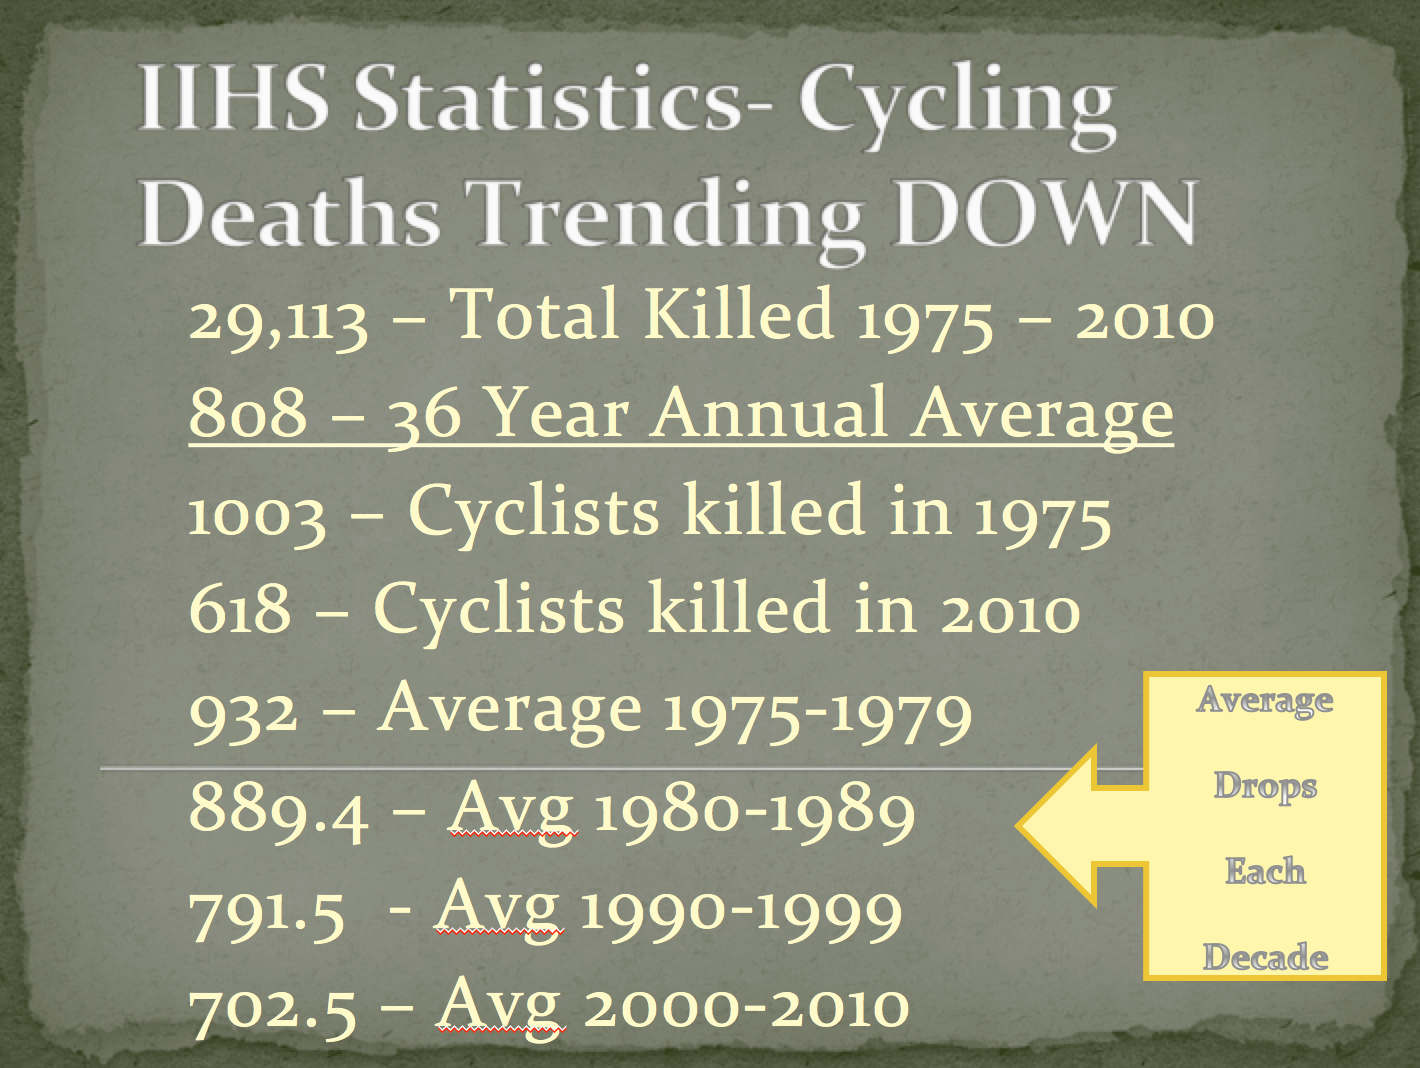
Suddenly… the trend reverses… cycling deaths start to climb. for 2010 – 2017 there were 5,954 cycling fatalities in the US, which averages out to 744.25 per year, a significant jump from the average of 702 for the previous decade!
PEDESTRIAN FATALITIES TRENDING UP IN THE LAST DECADE
In 26 states, including Ohio, pedestrian fatalities rose in 2008 compared to 2017. In Ohio we went from 55 to 63 pedestrians killed, a 15% jump. Overall, there 2343 86 more pedestrian fatalities in 2018 than 2017.
Five states, representing about 1/3 of the US population accounted for almost HALF [46%] of all pedestrian deaths. The Big 3 are easy – CA, FL & TX. What do you think the other 2 states were?
If you guessed big states like NY, PA, OH, IL, NJ, SC then you’d be …

WRONG…
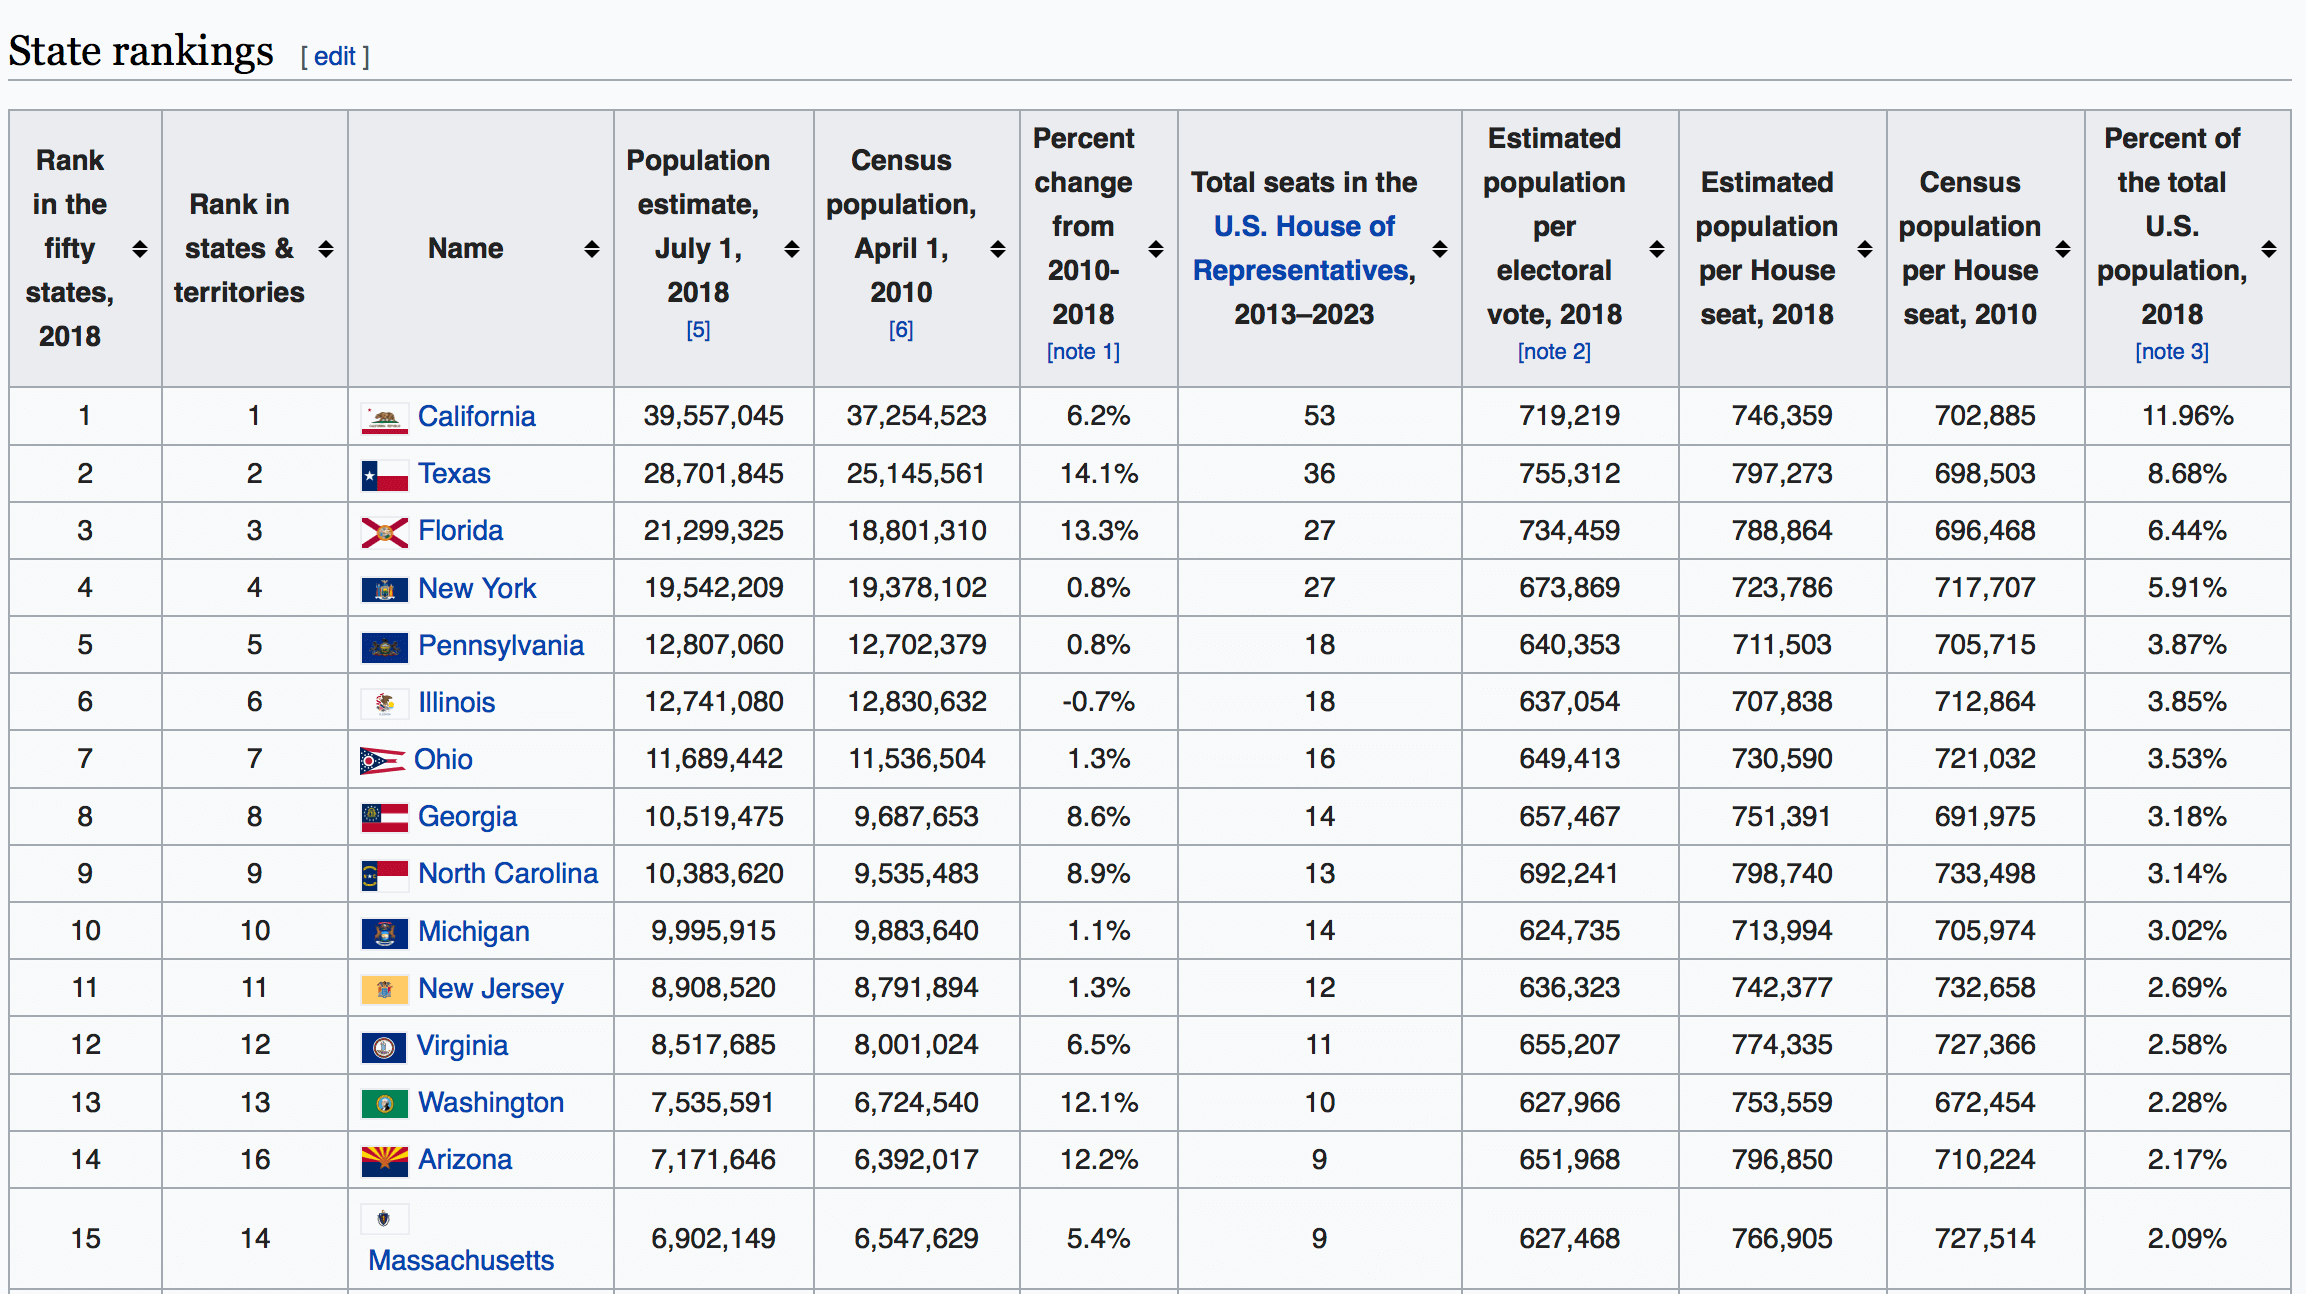
The top 10 biggest states, by population, are
CA – 39M
TX – 28M
FL – 21M
NY – 19M
PA – 12.8M
IL – 12.7M
OH – 11.6 M
GA – 10.5M
NC – 10.3M
MI – 10M
the Top 5 for Pedestrian deaths are
CA – 432
TX – 330
FL – 298
and then…
GA – 133
AZ – 125
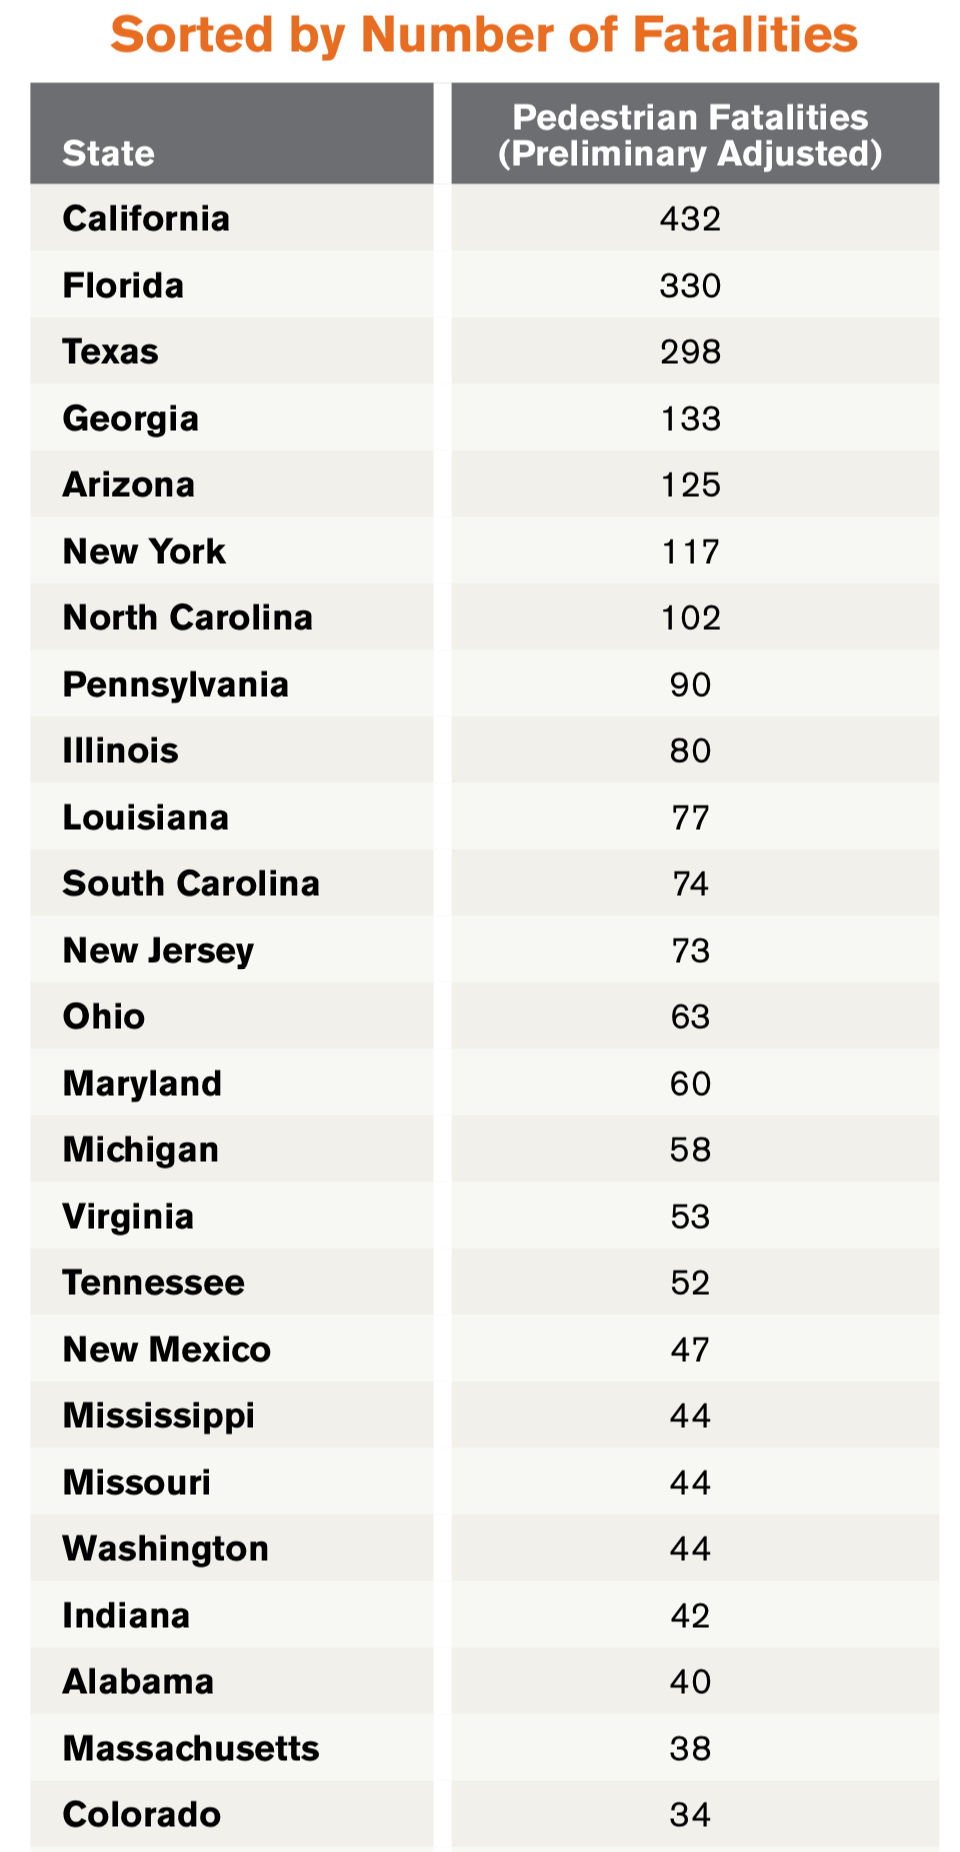
In fact, AZ had almost TWICE as many pedestrian deaths as Ohio [125 vs. 63 in 2018]which finished in 13th place in the total number of fatalities, but still rose 15%.
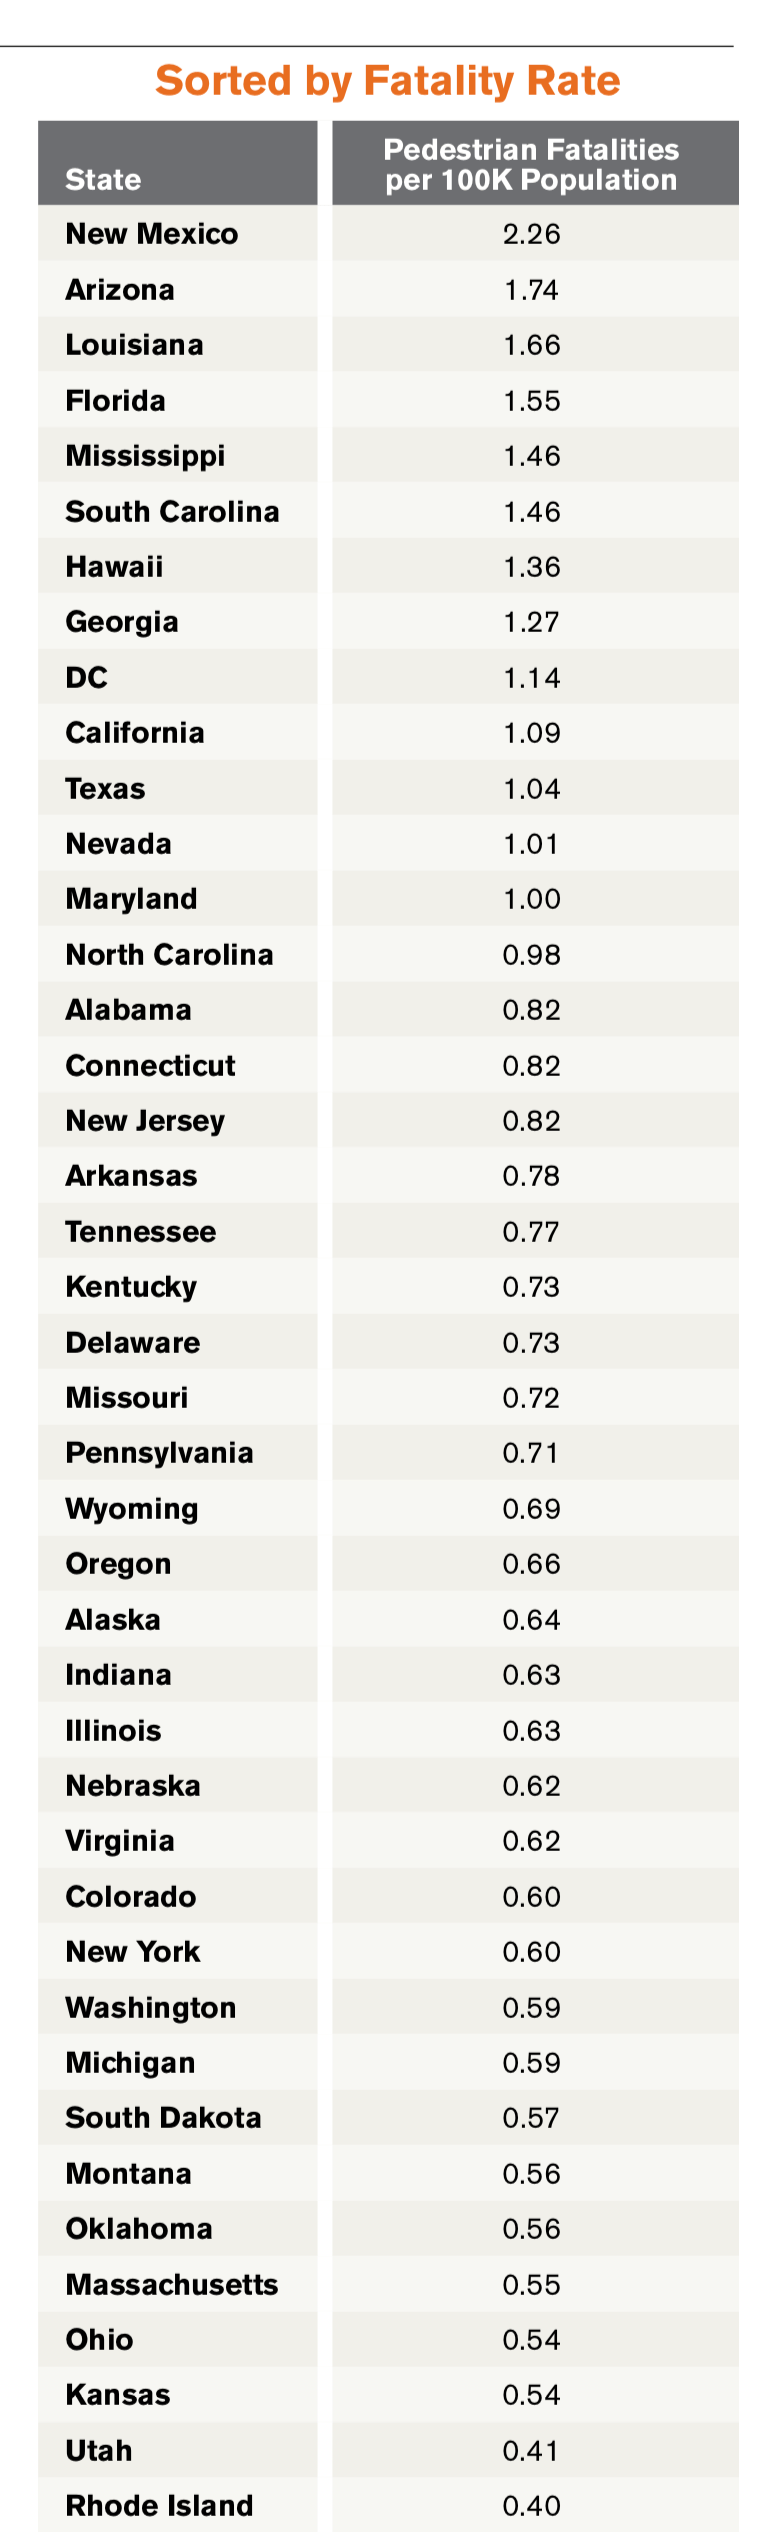
Now when you look at the numbers as a “rate” – i.e., per 100,000 people, Ohio looks much better – much safer.
Nationally the average “rate” for all 50 states is 0.88 pedestrian deaths per 100,000 people. The higher the “rate” the more likely you are to be a victim in that state.
The WORST states in this rating ranking are NM [2.26], AZ [1.74], LA [1.66] and then FL [1.55]
Ohio is WAY down this list with 0.55, which is 38th place… that’s a GOOD place for the 7th largest state to be and indicaties that walking around in Ohio is safer and you’re less likely to be killed walking around in Ohio, than in the 37 states with worse rates.
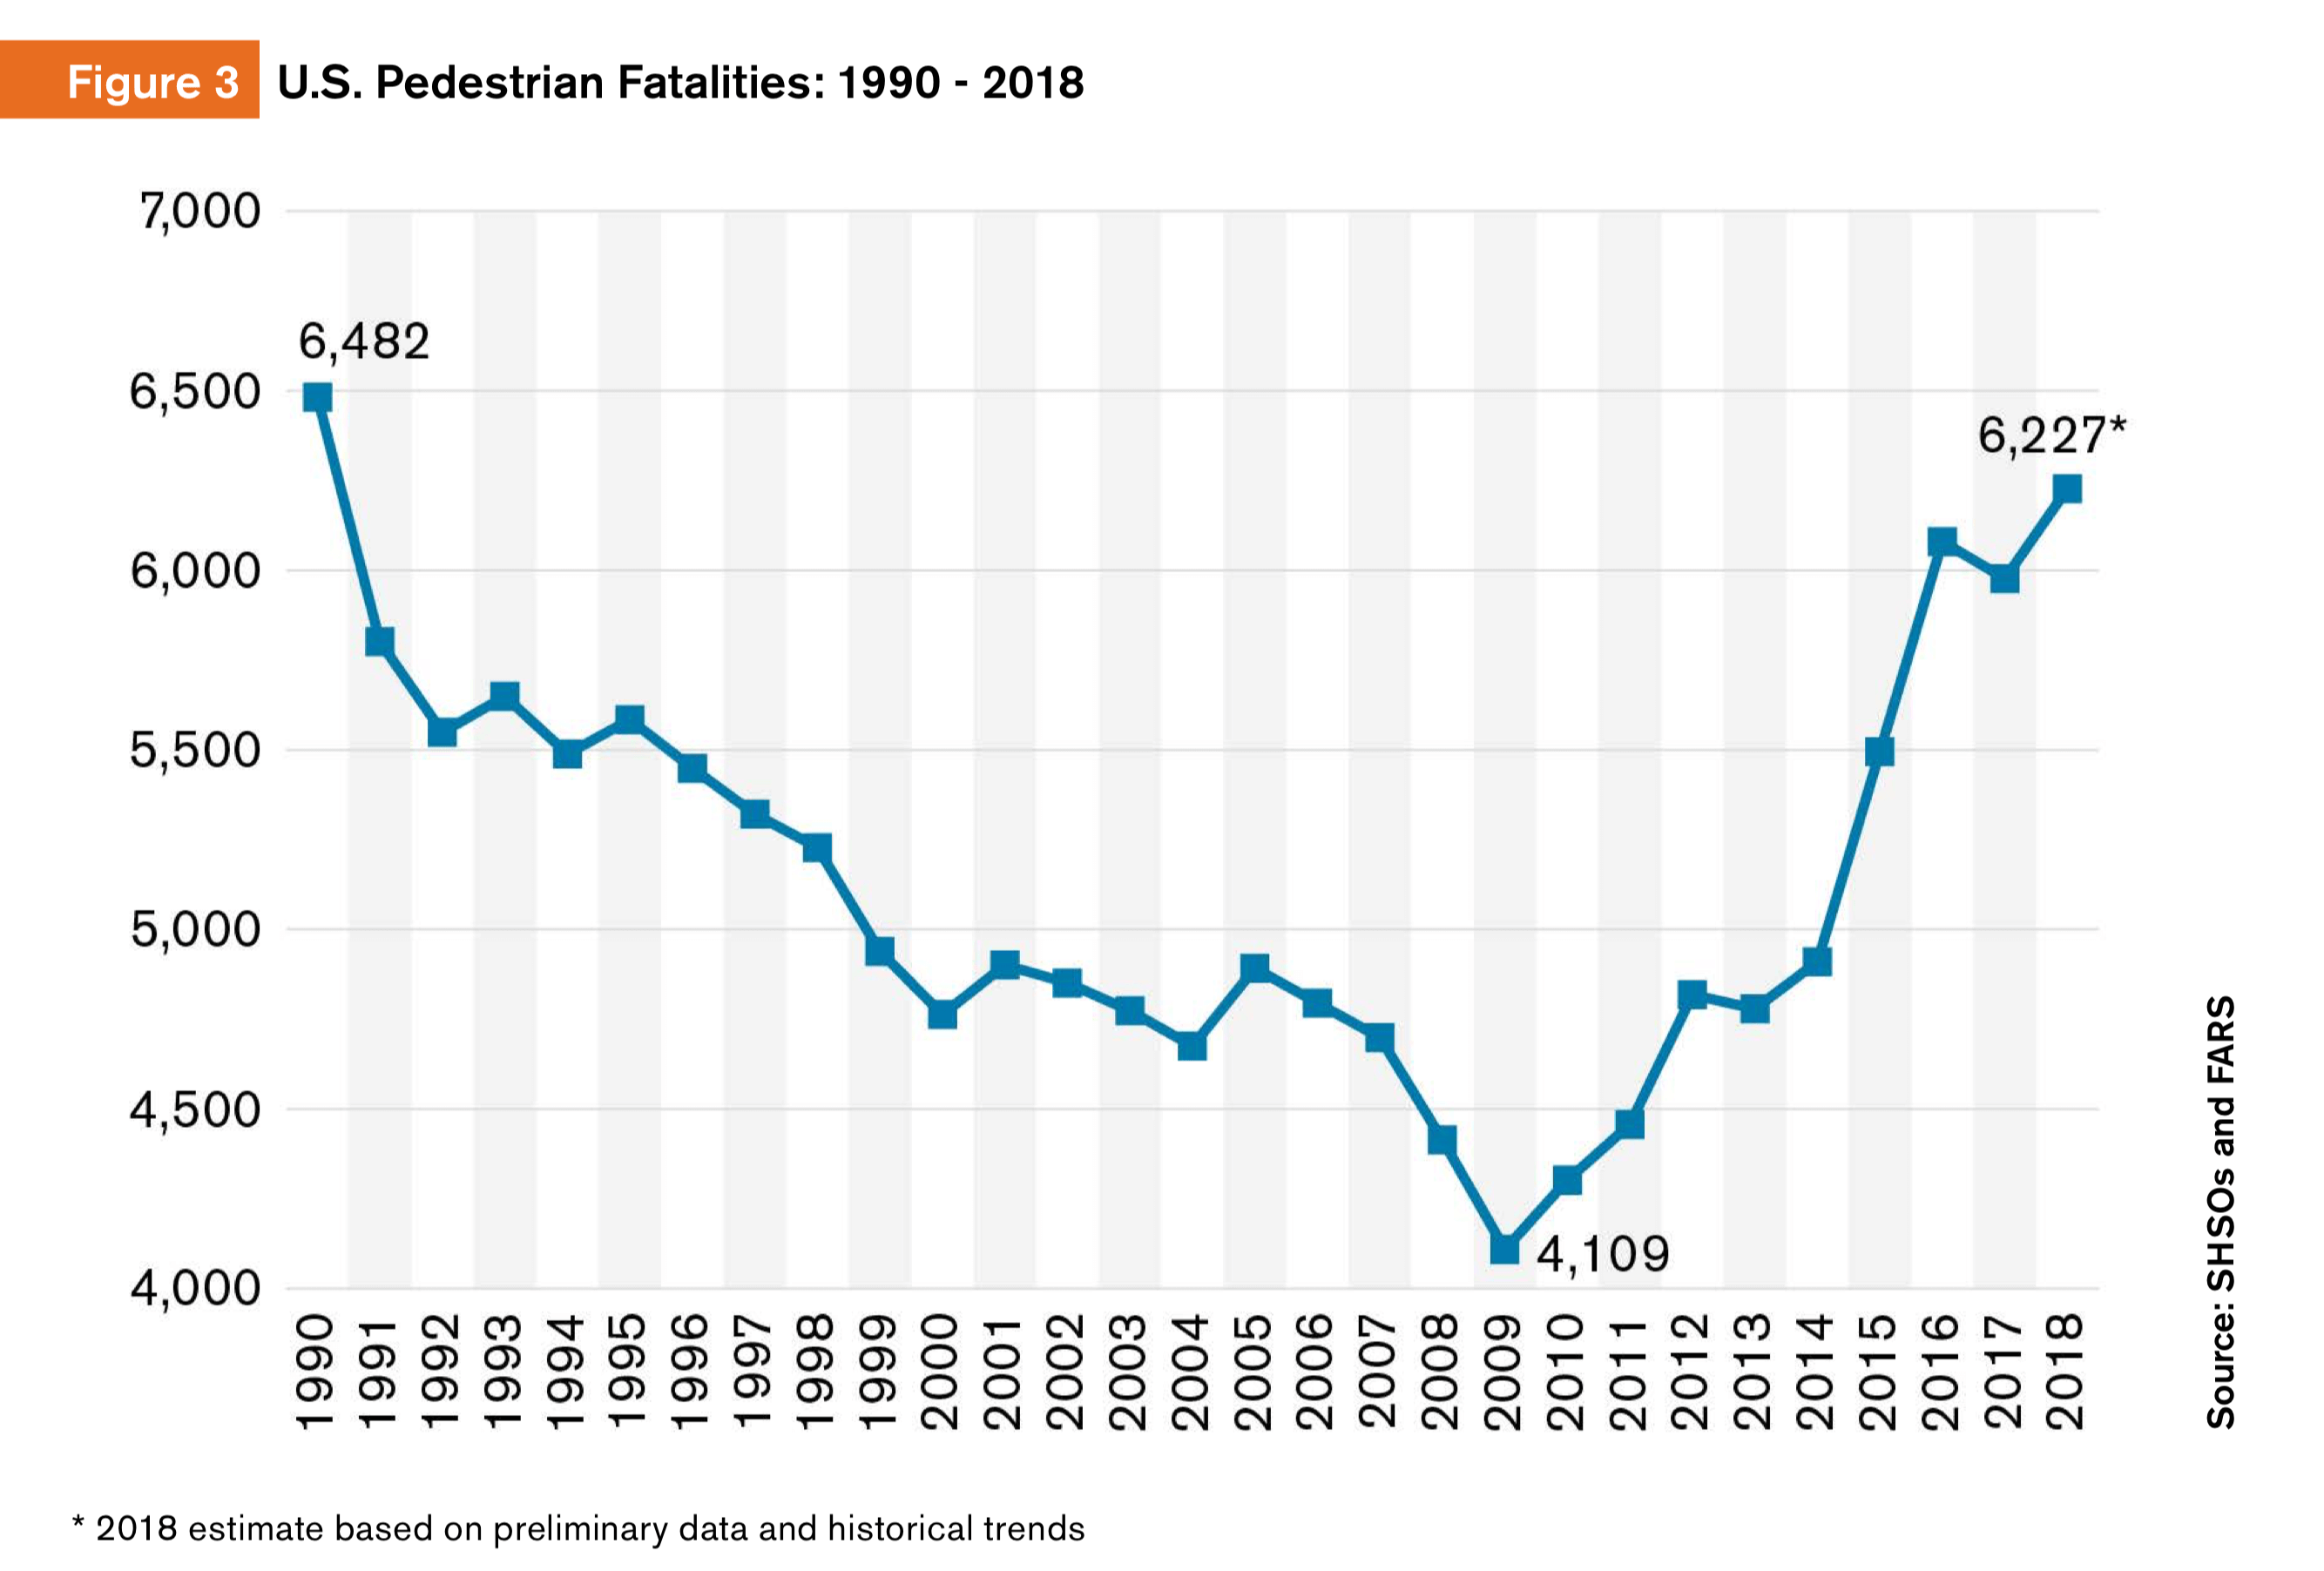
I know I’ve made this point a lot recently…but look at the data historically… Pedestrian fatalities [and bicyclist fatalities] dropped and dropped and dropped from 1990 to 2009…then a sudden, and sharp rise…
WHAT IN THE WORLD IS GOING ON?
What ELSE happened around that time? What changed in 2008-2009? Did pedestrians forget how to not walk in front of cars & get killed? Was there a nationwide concurrence among cyclists to start riding into the path of speeding cars?
Well, we know from the chart above that Urban crashes leading to death have been trending up during this past decade…
And… Oh gee… look…
The IPHONE comes out in mid-2007 & sales numbers start to go off the charts in 2008 and beyond…
But Wait… There’s More…
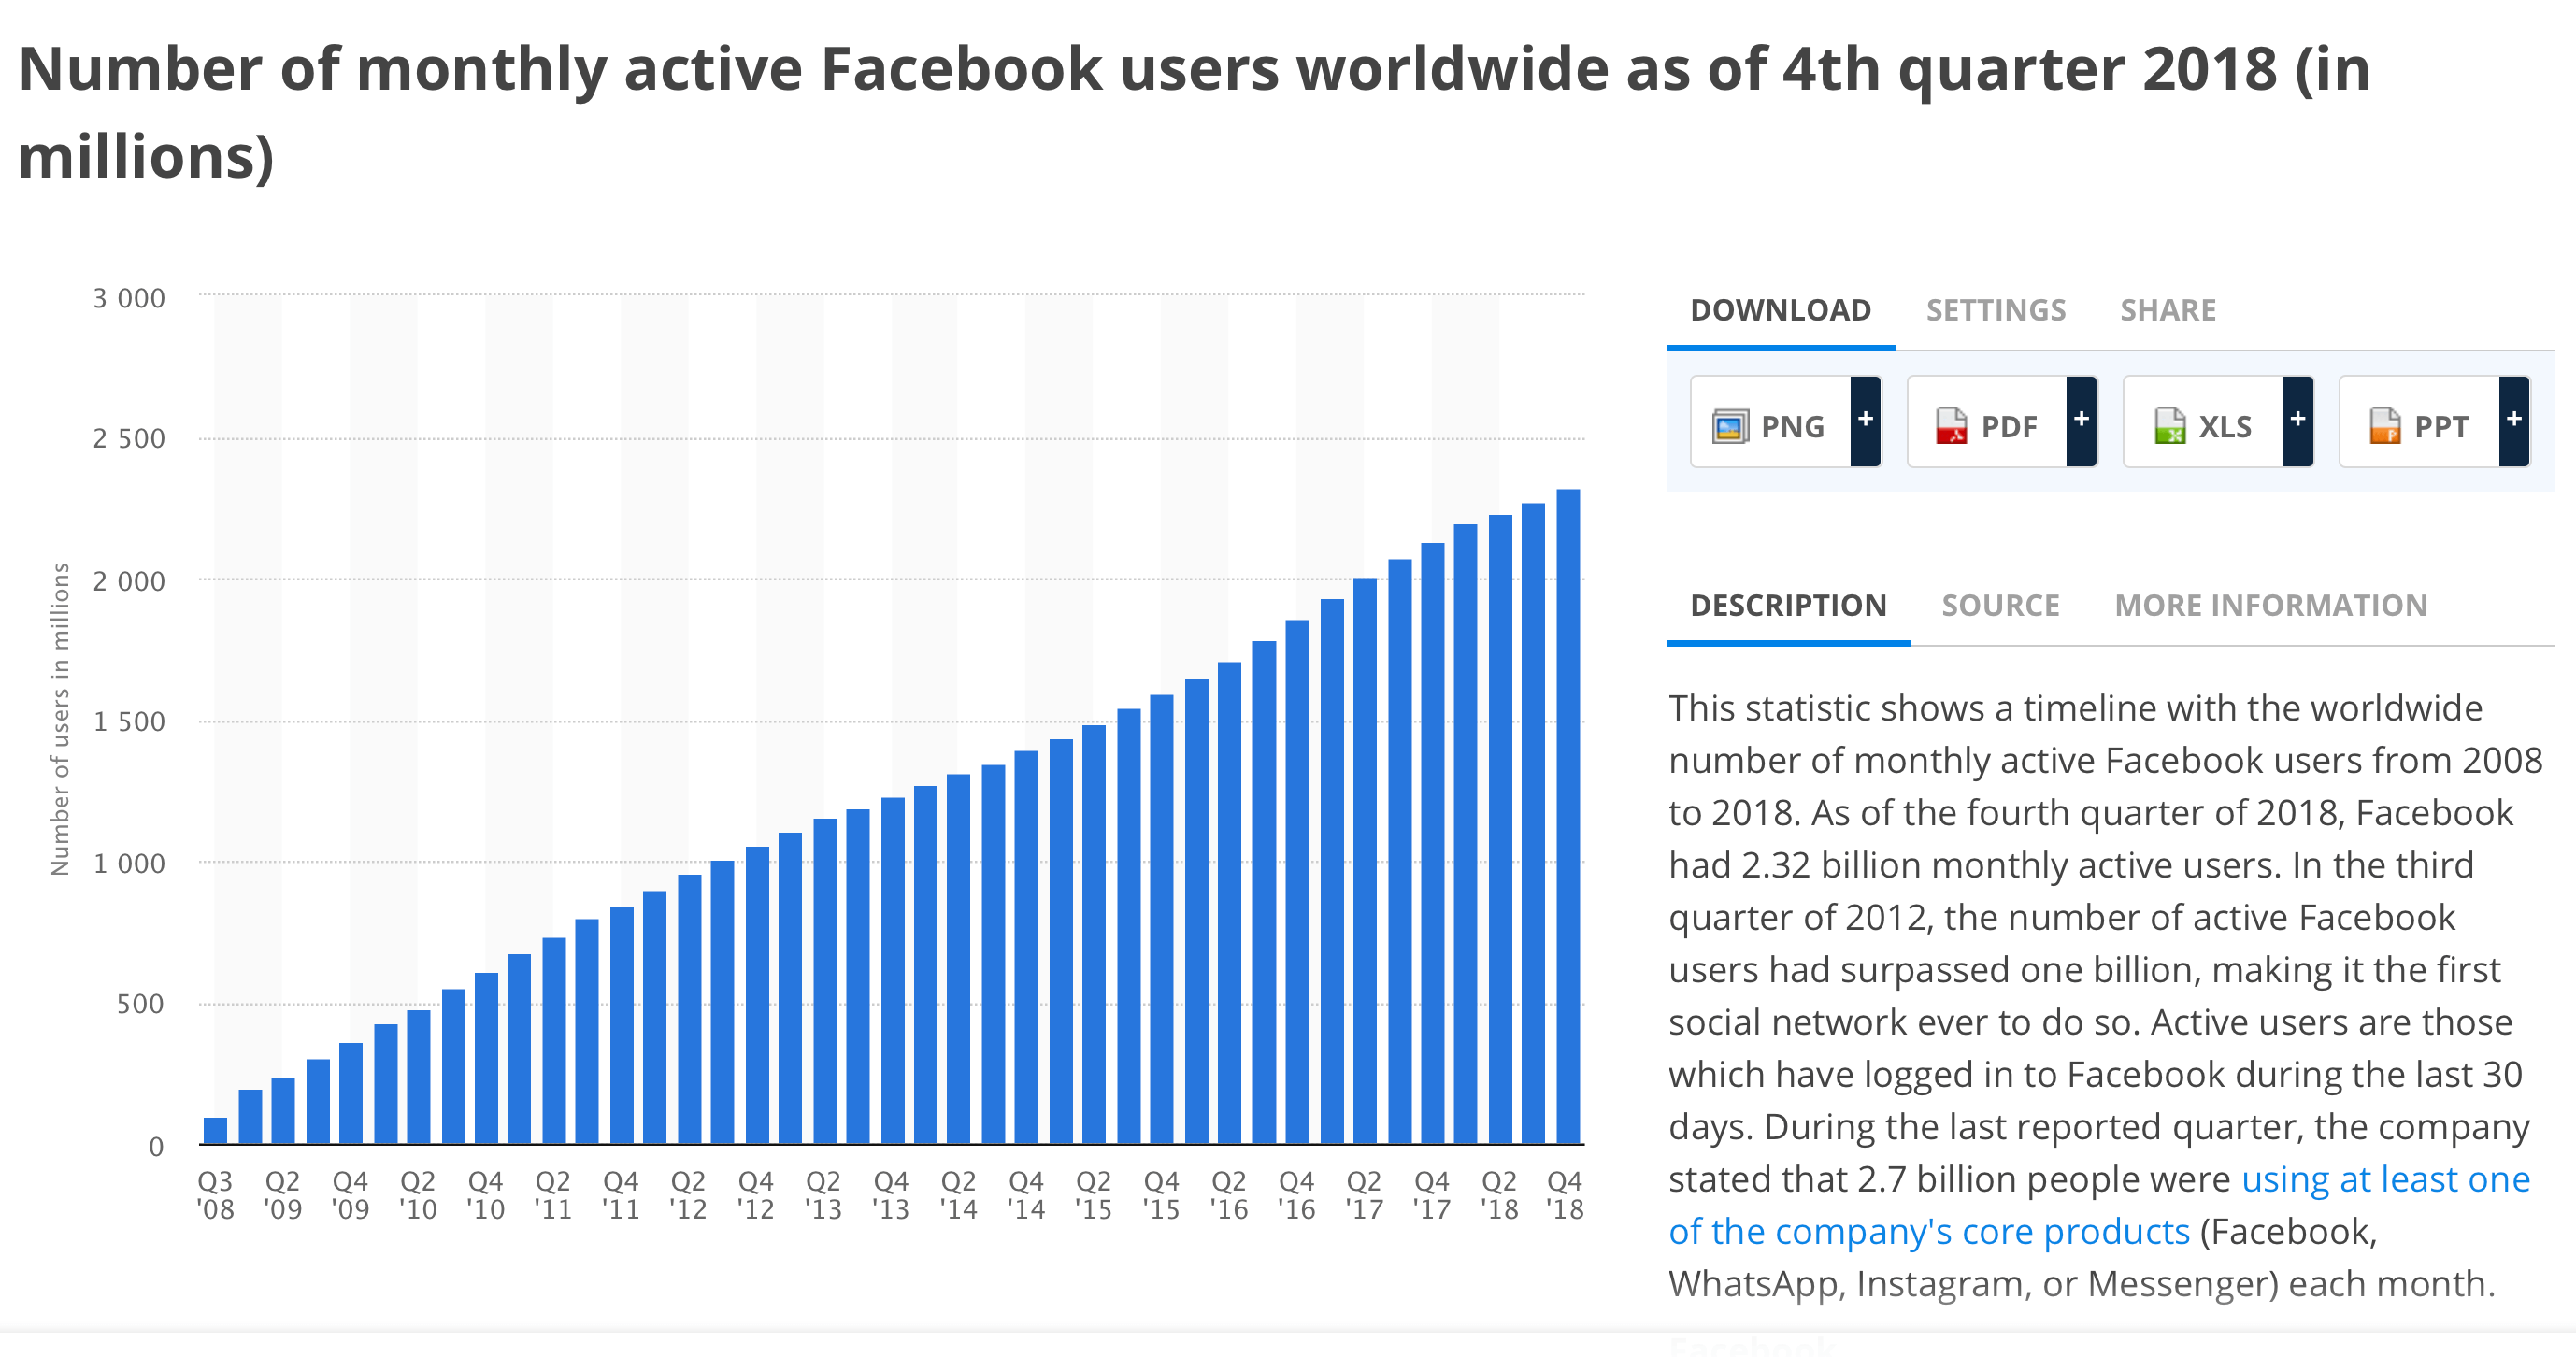
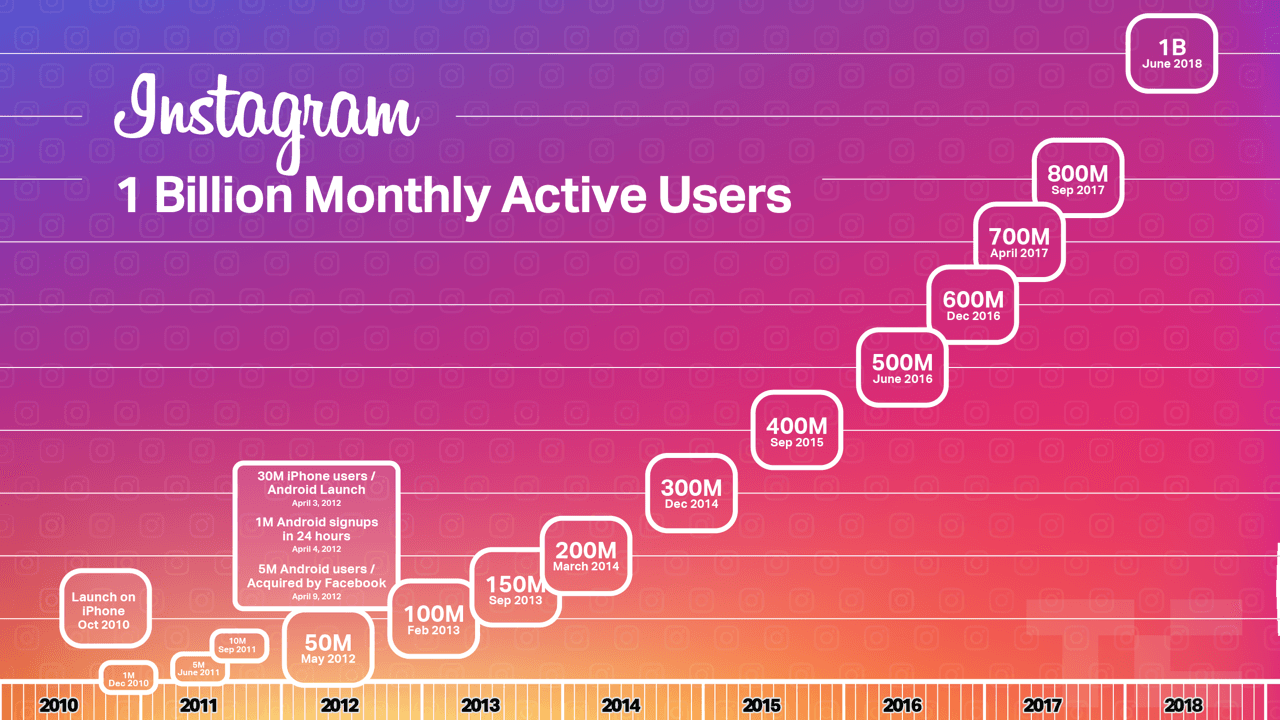
Facebook was just a little fledgling college gizmo back then – it was just a cool start-up app. “Social Media” consisted of MySpace at that point… but after 2008 or so… BOOM…
If you lay graphs of Facebook, Instagram, Twitter use over top of the pedestrian & cyclist fatality graphs you find that the increase in deaths charts right along with the massive increase of social media usage…
Just think about all that is made possible from the safety and comfort of your car. Now, while you sit behind the wheel trying to safely maneuver your 2 ton bowling ball through tight lanes and spaces, you can do all kinds of things. Once only astronauts had access to this kind of power… now YOU were able to carry a supercomputer in your hand and download faxes, write a Yelp review or practice piano as you drive down the road…

I keep saying, there’s a master’s thesis here waiting to be written …
The GSHA report is here
https://www.ghsa.org/sites/default/files/2019-02/FINAL_Pedestrians19.pdf
Tags: pedestrian, statistics
© 2024.

