HAPPY NEW YEAR!
Out with 2017 and onto 2018!
Here are some early returns on numbers… Ohio cyclist crash numbers – crashes – deaths – for 2017 from the Ohio Department of Traffic Safety’s crash stats page.
These are very preliminary numbers at this point. Ohio generally doesn’t finalize it’s “Crash Facts” report until much later in the year. The “trend” for Ohio is not good, however, and is something we, as advocates, need to study and work on…
=====
The Good – The Bad – The Odd – The Ugly
The “Good”
“Only” 1,371 bike/car crashes were reported in 2017 [so far]. That’s a fairly low figure, which is likely to change as Ohio’s 800+ Law Enforcement Organizations finish up their reports and get them in.
For several years, Ohio averaged close to 2,000 bike/car crashes. Then, all of a sudden, A MIRACLE OCCURRED, and the number dropped to around 1,500…

OK…
Maybe a miracle didn’t really occur…
Rather, perhaps an administrative change in the definition of the type of crash which would generate a report and “count” in the stats came about and the number went down dramatically. Deaths and serious injuries stayed the same, but the lesser crashes were not reported as frequently.
What was this magical “administrative change” you ask?
It used to be that $400 in property damage was sufficient to generate a crash report that added to the total – the State bumped up the minimum damage for reporting such crashes to $1000 and the number of crashes dropped by 25%… don’t you just FEEL 25% safer?
So yay for us- so far the car/bike crash count for 2017 stands at 1,371. In 2016 we have 1,505 and we have averaged around 1,500 since “the Change” occurred…
The Bad
19 Ohio cyclists were killed on the roads. We are still in the process of obtaining the full and complete report for all 19 fatalities. Some, many, are still be prosecuted or investigated, so we only have preliminary information.
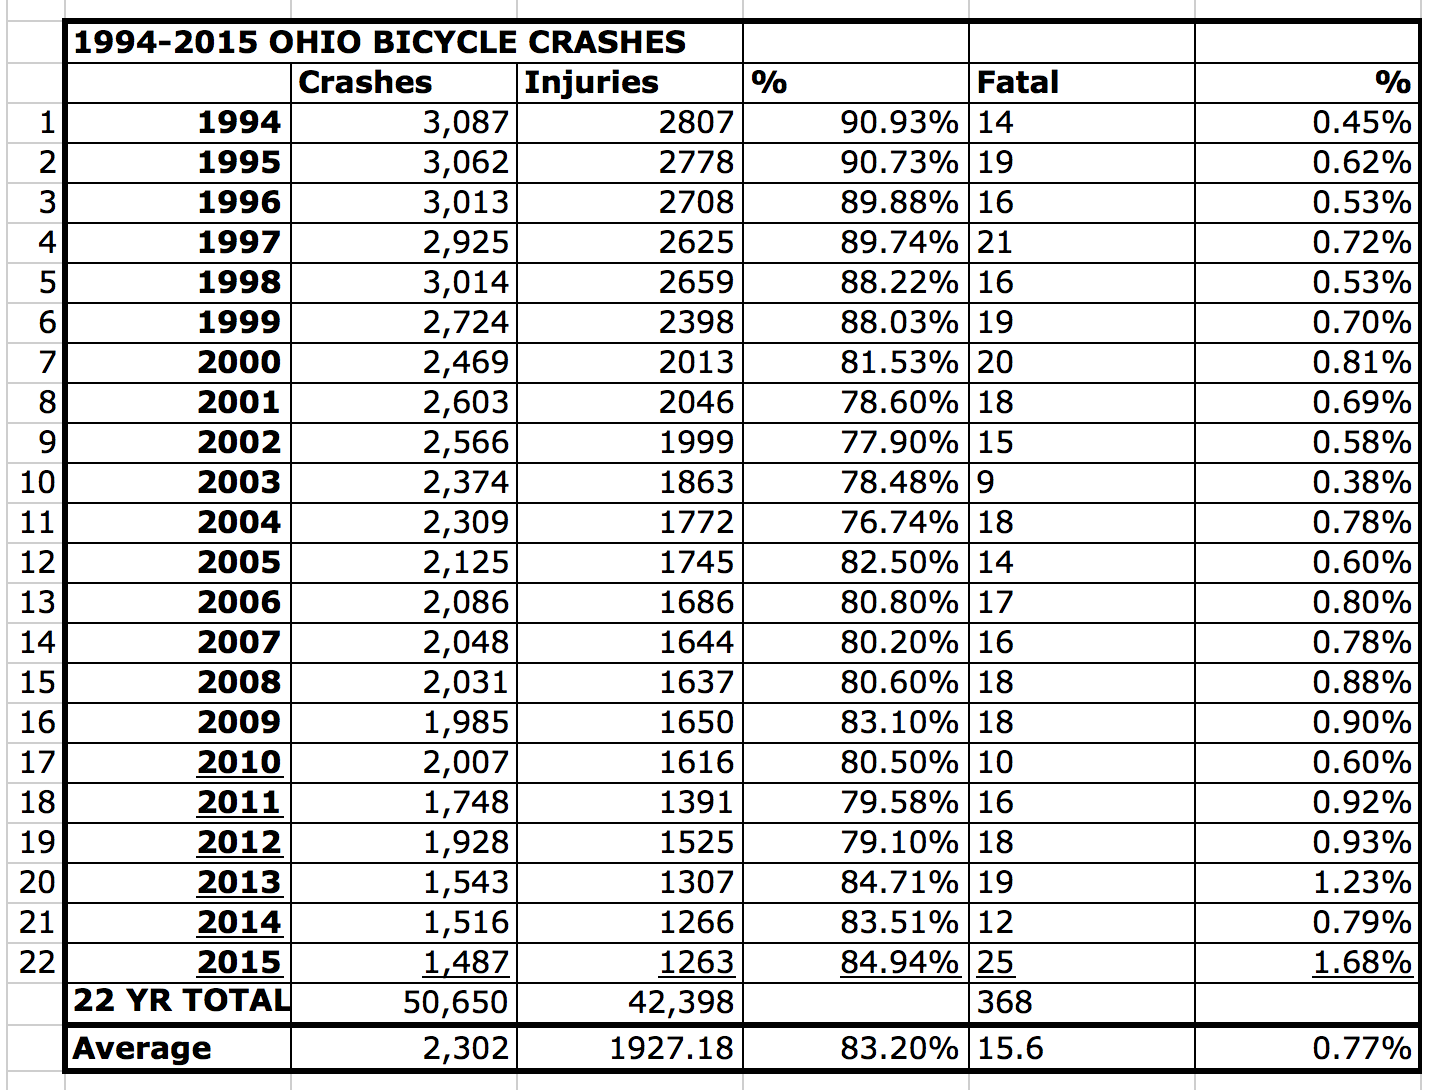
19 is a bit high for Ohio – we’ve averaged around 16.5 over the past 20 years or so. However, 2015 was our worst year ever with 25 fatalities. We had 18 in 2016 and now 19 in 2017. That’s a lousy trend
It’s impossible to assess “risk” or whether things are “worse” in Ohio now than they were a few years ago. My “sense” is that we are riding a LOT more than we “used to” say, 10-15 years ago. More riders on the roads. More urban riding. More fitness riding. Lots of club riders. More active cycling groups and clubs. More interest in cycling. But… we don’t have data for that… it “feels” like more people are riding and, if so, one might expect the numbers to go up a bit – especially if the new riders are not so experienced on the road and may make more errors than road warriors, commuters, etc…
The Odd
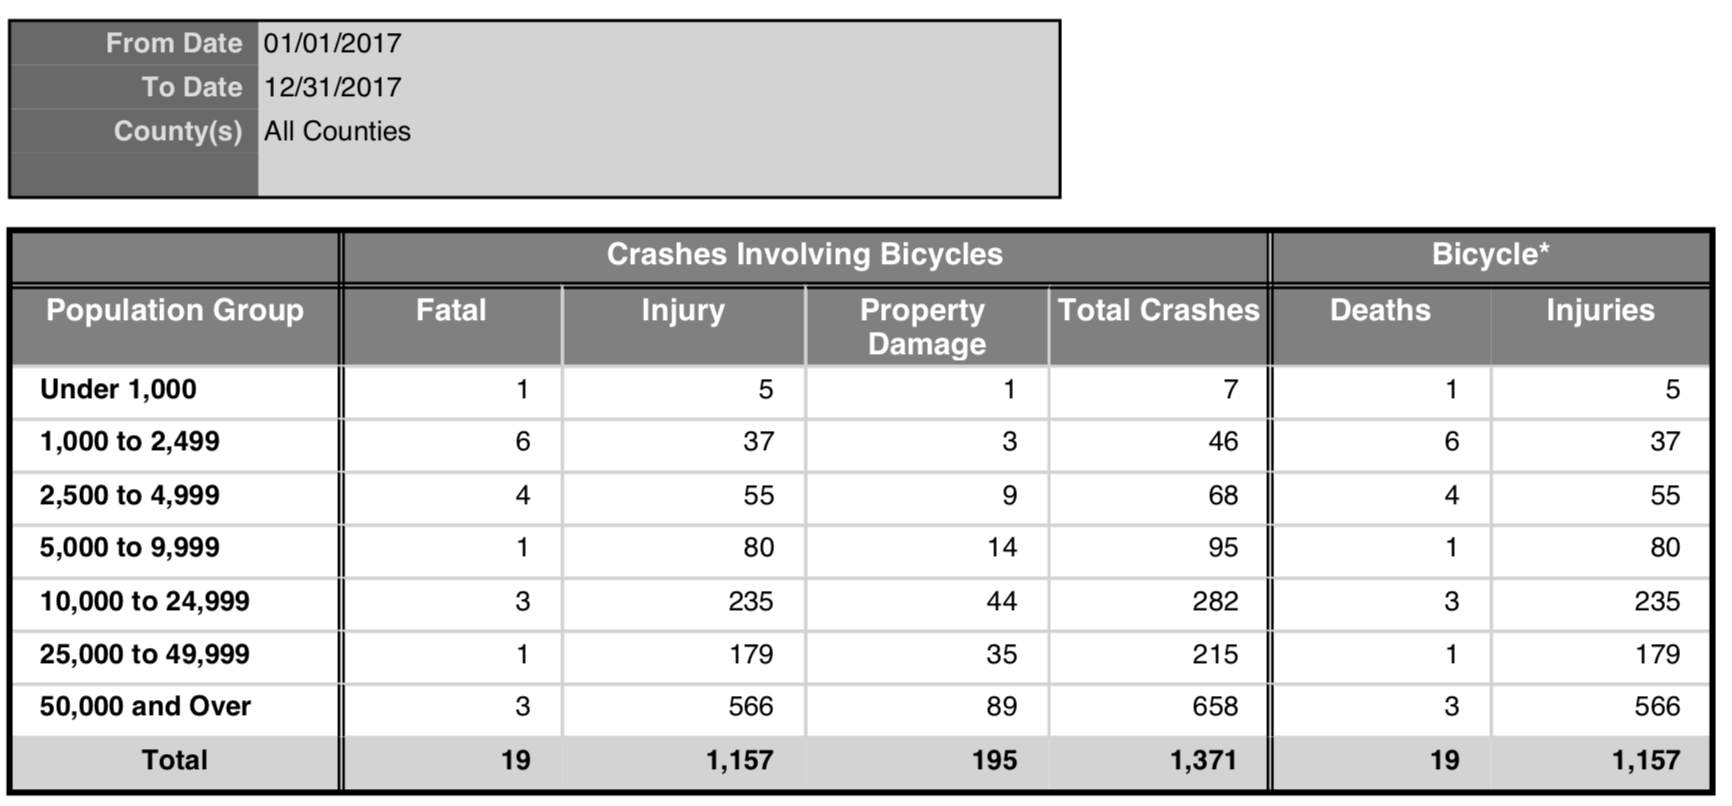
Every report I read about crash stats on a national basis tends to say that most fatal crashes occur in “Urban” areas. However, that’s just not true in Ohio. As the chart below shows, in 2017 only 3 of 19 fatalities occurred in areas with a population in excess of 50,000. In fact, 12 occurred in cities/areas with populations of LESS THAN 10,000!
I think the national figures tend to be skewed by Florida and California and Texas numbers – especially Florida, which had 150 cyclists killed on its roads in the disastrous 2015 cycling year…
Here in Ohio we certainly have some bigger urban settings – Cleveland, Columbus, Cincinnati, Toledo, Youngstown, Dayton, etc etc. – and cycling is skyrocketing in many of these settings as local clubs and advocacy groups are doing a fantastic job in getting “butts on bikes”… However, only 15% of Ohio’s cycling deaths in 2017 occurred in bigger cities and 85% occurred in rural areas.
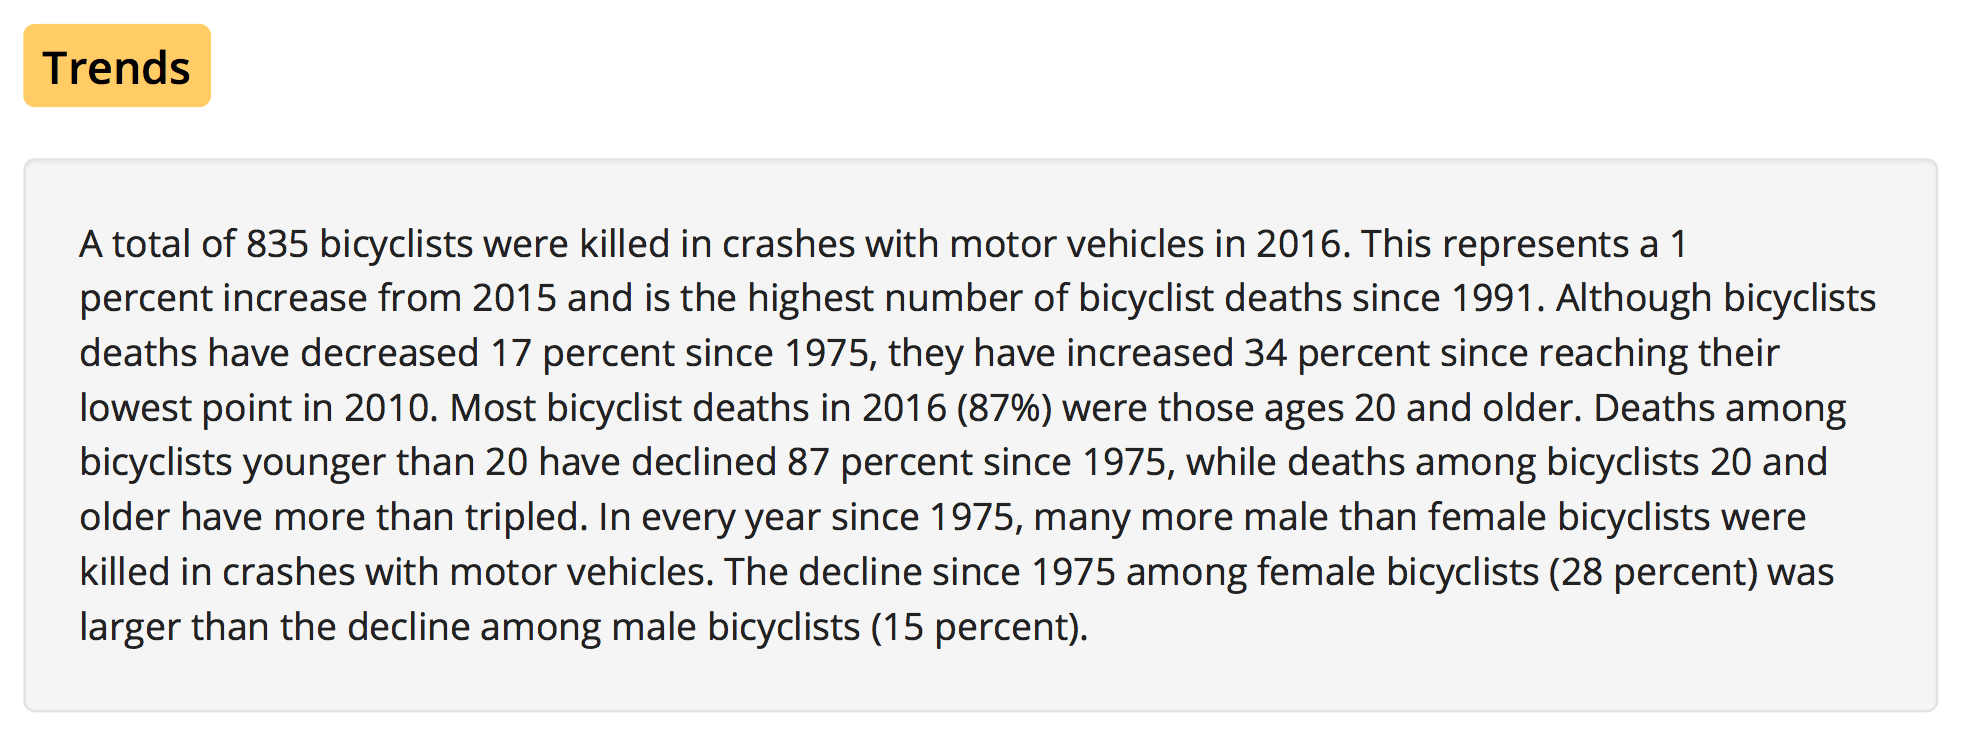
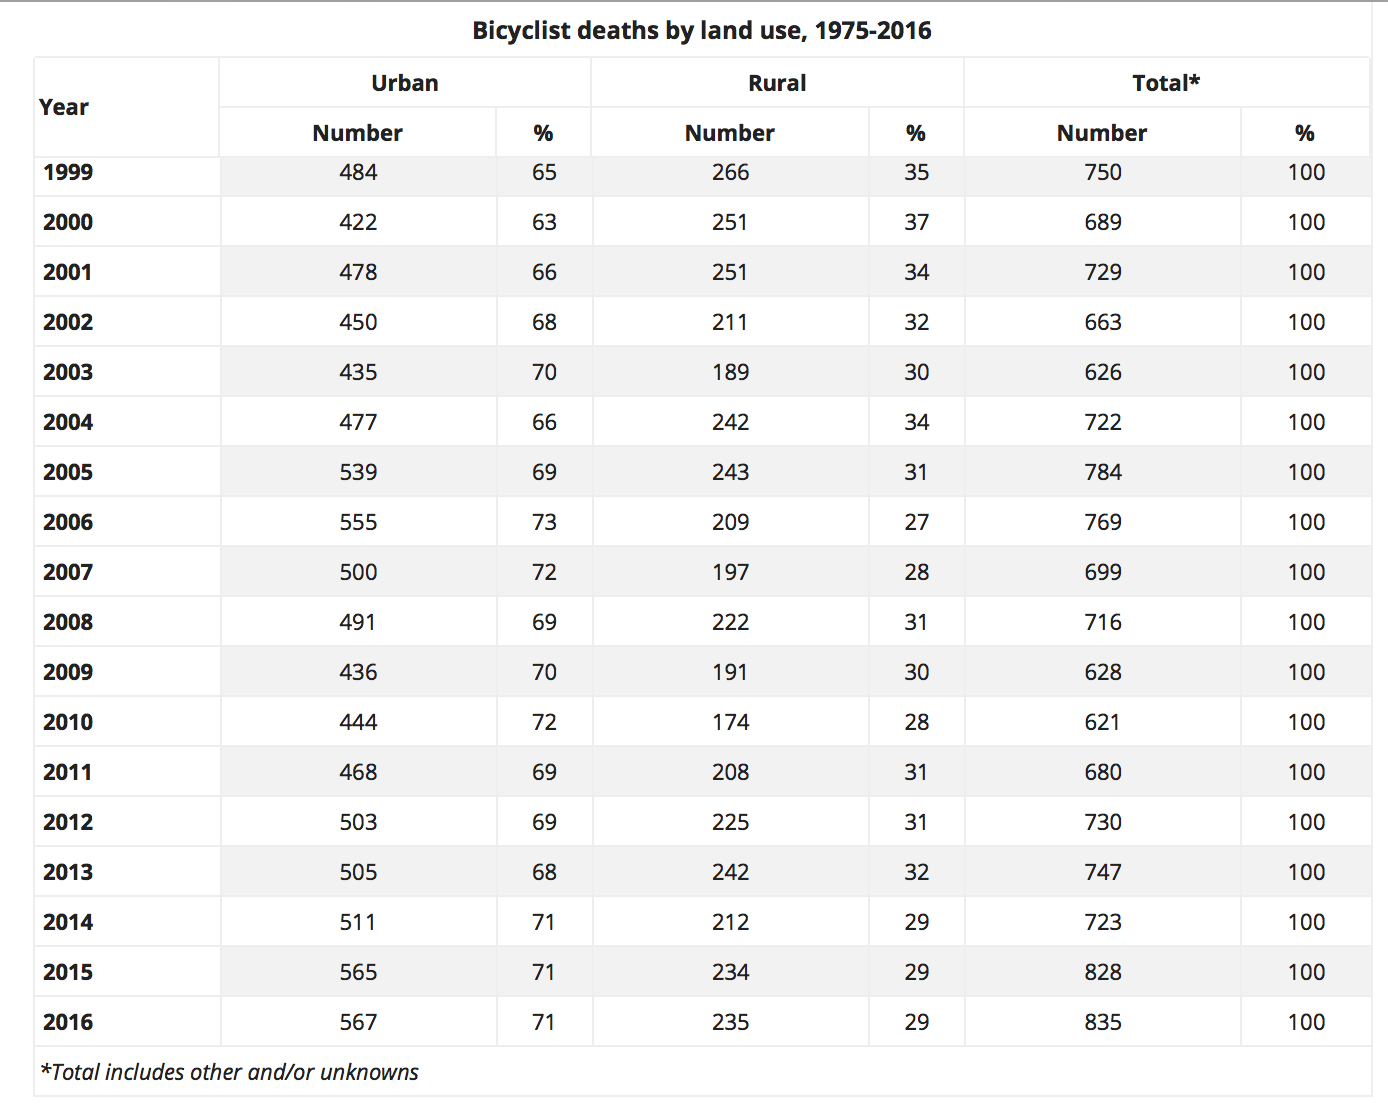
The IIHS [an insurance-funded group that studies crashes and puts out “crashworthiness” ratings for cars] has a “Bicycle” stats page. Here’s what they about the “Trends” of cycling crashes nationally. As you can see, their breakdown, nationally, is that 71% of cycling deaths over the past 3 years have occurred in URBAN not “Rural” settings. Again, this could represent sort of definitional quirk but we’re simply not seeing that “trend” here in Ohio.
Once we have the full reports for all 19 crashes we can begin to look at how and where these crashes occurred and try to figure out why… however, “patterns” are just not there. Other than Columbus consistently having multiple fatal crashes year after year, the other urban settings in Ohio rarely have one…
The Ugly
Darkness… is NOT your friend.
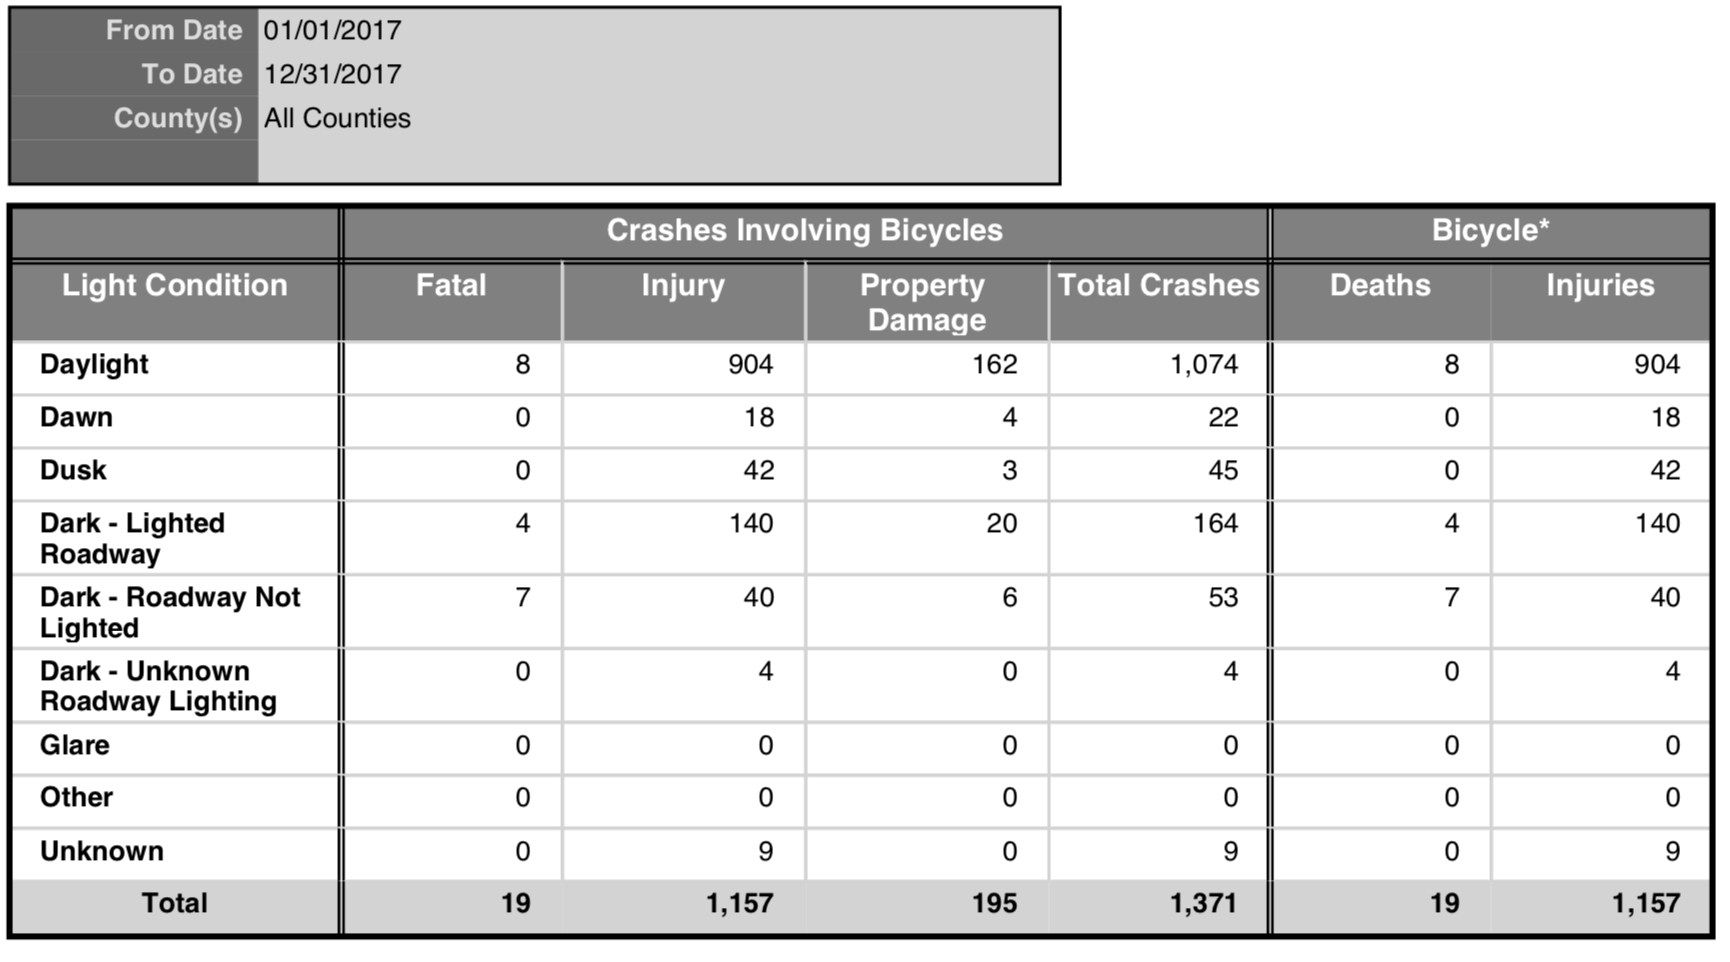
Of the 1,371 crashes reported so far only 221 of them were noted as occurring in the “Dark” – [another 60 occurred at dusk or dawn]. Those 221 crashes represent only 16% of all Ohio bike/car crashes …However, 11 of Ohio’s fatal crashes – a huge, whopping 59% – occurred in the DARK…
Clearly a small fraction of Ohio’s cycling occurs in the Dark but a BIG Fraction of our crashes and an even BIGGER Fraction of our cycling Deaths occur in the Dark… That’s a huge issue.
Once we have the full crash reports we can issue some details and facts to go behind the numbers and see what really happened. Are those killed while riding bicycles in the dark doing stupid things? Are motorists doing stupid things? Are the cyclists lit up appropriately? Were they riding legally? Were they serious riders? Commuters? People riding to work? Riding home from the bars? Folks just out riding around in the dark??
We know why riding in the Dark is so dangerous right? YOU CAN’T SEE IN THE DARK – or rather, it is very difficult for You to be SEEN and “PERCEIVED” by a motorist with sufficient advance warning of your presence to allow the motorist to make smart tactical driving decisions. Lights are mandated by law, but you really need to GET LIT if you are riding in the Dark … make yourself as conspicuous as you can. You want to pierce that motorist’s [tiny little] brain as early in the traffic scenario as possible…
We will continue to monitor the safety of Ohio cyclists. From an overall perspective, Ohio remains a VERY SAFE place in which to ride a bicycle.
Let’s be CAREFUL out there!
Printed from: https://ohiobikelawyer.com/bike-law-101/2018/01/ohios-2017-bicycle-crash-stats-the-good-the-bad-the-odd-the-ugly/ .
© 2024.
© 2024.
Accident Reconstruction Alcohol Bicycle Gear Bike Law 101 Conspicuity Court Cases Criminal Motorists Distraction Dogs Historical Insurance Statistics Touring
You can leave a response, or trackback from your own site.


Alcohol but not Drugged driver catagory listed above. Important stat would include all bike-car crashes regardless of injury as the cyclist may have been lucky not to be killed/incapacitated. The perception of safety is critical – if a rider does not feel safe they will not ride, which is why I am working locally to develop more cycling infrastructure. In Cincinnati area we are fortunate to have several trails and some on-street facilities.